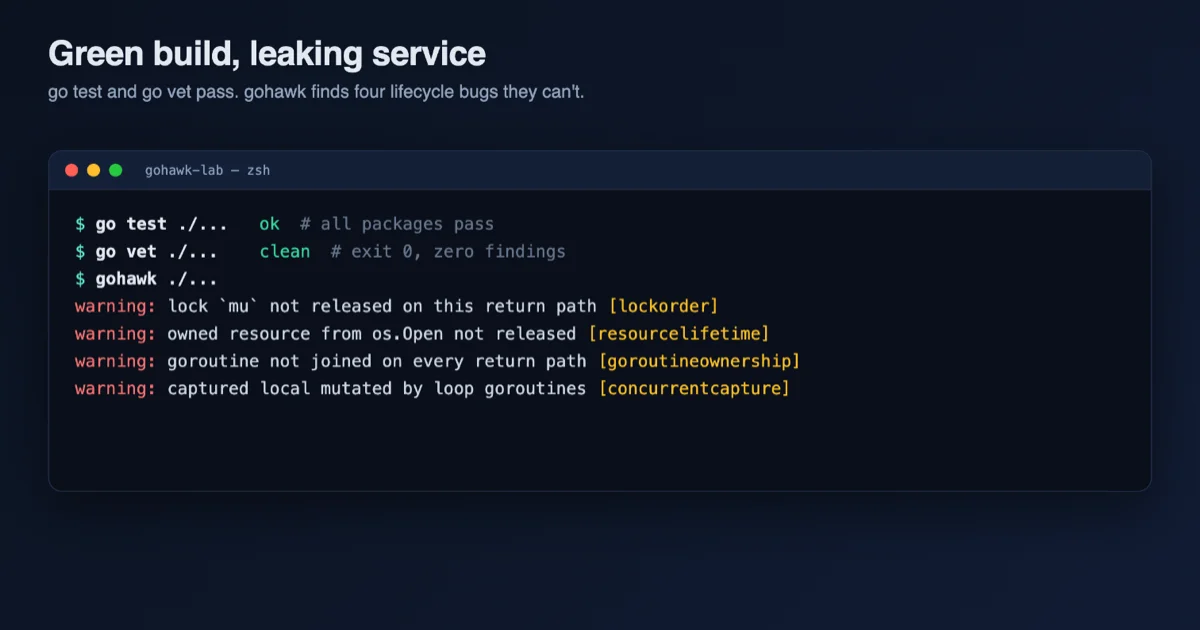
A Go service can pass every test, clear go vet without a word, and still be quietly broken. The kind of bug I mean does not throw an exception or fail an assertion. It leaks. A file handle that never gets closed, a goroutine that nobody waits for, a lock that an early return skips over. Each one is invisible on a laptop with a single request in flight, and each one turns into a 3 a.m. incident once real traffic arrives: file descriptors exhausted, memory climbing with abandoned goroutines, a handler wedged on a lock that was never released.
These are lifecycle bugs. They are about when a resource is acquired and released across every path a function can take, and they are exactly the class of defect that unit tests and ordinary linters tend to wave through. Best practice says a test suite should cover the error paths and edge cases, not just the happy path. In practice most suites lean on the happy path anyway, written by the same people who wrote the code and exercising the inputs those people expected. That is the same blind spot that makes fuzzing a running API worthwhile. But lifecycle bugs run deeper than which paths you test: even a suite that exercises every error path checks what a function returns, not whether it closed the file handle or released the lock on the way out, and a leaked goroutine or an exhausted descriptor is invisible with one request in flight, surfacing only under real load. gohawk goes after that from a different direction, reading the source instead of running it. Linters like go vet look at one function at a time and flag local patterns, not the cross-function question “is this file closed on every return.”
This week the Rabbit Hole Generator, the little automation that hands me one unfamiliar tool to tear into every few days, gave me gohawk: a set of static analyzers built specifically to catch those lifecycle bugs in Go. I built a small module with four planted leaks, confirmed that the whole standard Go toolchain shrugs at them, and then watched gohawk find all four. Along the way it also refused to report a fifth bug I expected it to catch, and the reason turned out to be the most interesting part of the exercise.
What is gohawk used for in Go reliability?
gohawk is a collection of static analyzers for Go that specialize in concurrency correctness and resource-lifetime tracking. Static analysis means inspecting source code without running it, the way a proofreader catches problems by reading rather than by acting out the story. Where go vet and popular linters focus on general correctness and style, gohawk focuses narrowly on whether owned resources (files, locks, goroutines, SQL handles, HTTP response bodies, cancellation functions) are released on every path out of a function. Its distinguishing trait is that it reasons across function and package boundaries, so it can follow a file handle opened in one helper and see that a caller three functions away never closes it. The project says it has been used to find and fix real bugs in Docker, Kubernetes, and Caddy.
The Architecture: compositional summaries borrowed from Infer
The obvious way to check “is this resource released on every path” is to follow every path through the whole program at once. That approach is called whole-program analysis, and it gets slow fast. Every if and every branch roughly doubles the number of paths you have to walk, so on a real codebase there are far too many to check in a reasonable amount of time.
gohawk takes the approach that Meta’s Infer made famous, called compositional analysis. Instead of re-reading a function every time it is called, gohawk analyzes each function once and writes a compact summary of what that function does to its arguments and return values: whether it closes a file, releases a lock, waits for a goroutine, or hands ownership of a resource back to its caller. Callers then read the summary rather than stepping through the called function again. Think of it like a supplier’s certificate of analysis: once a part is tested and documented, everyone downstream trusts the certificate instead of re-testing the part. That is what lets gohawk follow a resource across helpers and package boundaries without re-reading the whole program every time a function is called.
That design is also why gohawk can say something go vet simply cannot. go vet reasons about one function in isolation; it has no summary for what a helper in another package does with the handle you passed it. gohawk’s summaries are exactly that missing piece. This only works if the summaries carry enough context to be accurate. The lab shows what happens when they do not: when ownership gets murky, gohawk reports nothing instead of guessing. That matters in practice, because a tool that guesses wrong too often gets switched off by the team.
gohawk ships as a standalone binary, as a go vet tool (so you can run it through the toolchain you already have), and as a module plugin for a custom golangci-lint build. That matters because it means the same analyzer runs both at a developer’s desk and as a CI policy gate.
The Reality Check: where gohawk breaks
The Rabbit Hole Generator pairs every tool with a “Critics Corner,” a list of the ways the thing can fail or the assumptions it quietly makes. gohawk’s pitch is appealing, so these are the counterweights. I have grouped them the way the critique falls out: three ways it fails at scale, two assumptions baked into how you are meant to run it, and one way the tool itself becomes an attack surface. Where the lab could test a point honestly on a single laptop, I say so and link to the step; where a point genuinely needs huge scale or malicious input I could not fake, I say that too.
1. Interprocedural analysis gets expensive at monorepo scale
Interprocedural means following calls between functions, and a monorepo is a single repository holding many projects. The summary model is cheaper than whole-program analysis, but it is not free. Building summaries, loading every package, and holding analyzer state still costs CPU and memory, and a broad gohawk ./... across a large monorepo can be heavy enough that you would not want it on every commit. My four-package toy cannot reproduce monorepo pain, but gohawk’s dump budget view shows where the cost actually lives even at this scale:
$ gohawk dump budget ./...
slowest runs:
        1ms  goroutineownership on .../internal/pipeline
        ...
dependencies:
      914ms  lifecyclefacts over 57 packages
      270ms  resultfacts over 57 packages
budgets: no search ran out
2627 more while summarizing dependencies; -deps lists them
The per-package analysis is sub-millisecond; the time goes into summarizing dependencies. A trivial four-package program still drags in 57 packages’ worth of standard-library and transitive code that gohawk must build summaries for, with 2,627 more summaries pending. That count is what grows on a real monorepo. Run dump budget first to see where the time goes; the line budgets: no search ran out confirms nothing was cut short. The last section covers when to scope the run.
2. Dynamic ownership can hide the lifecycle from static analysis
Static analysis can only track a resource it can follow. When ownership moves through interfaces, callbacks, generated wrappers, reflection, or a dependency-injection container, the lifecycle becomes invisible to the analyzer. I tested this one, and it is the most useful finding in the post: in lab step 6 gohawk’s goroutine analyzer hit exactly this wall and, instead of guessing, reported nothing with an internal verdict of “unknown.” That is the design working as intended, and it is also a real limit: code that leans on dynamic ownership will get less coverage, quietly.
3. False positives push teams to blanket suppression
The failure mode that kills a static analyzer in practice is not missing a bug, it is crying wolf. If experimental or newly tightened checks fire often enough on code the team believes is fine, people stop reading the findings and suppress them globally, which throws out the true positives with the false ones. gohawk’s structural defense is its tiering: a conservative core set runs by default and noisier checks are experimental, opt-in only (see lab step 3). I did not provoke a false positive in the lab, and notably the one time gohawk was unsure it stayed silent rather than guessing, which is the behavior you want. But “manage the tiers well and you will be fine” is itself an assumption, which is the next point.
4. The summaries are assumed to carry enough context
The entire approach rests on function summaries preserving enough ownership and synchronization context to model real call chains accurately. When they do, you get the cross-package magic. When they do not, you get either a miss or a backed-off “unknown.” The lab shows both edges of this: the compositional model correctly suppressed a file-descriptor leak that genuinely cannot hurt anything (step 5) and correctly declined to rule on a goroutine whose ownership escaped through a channel (step 6). Both are the summary assumption meeting its boundary. Trusting gohawk means trusting that boundary is drawn conservatively, which, in my small sample, it was.
5. You are assumed to understand and manage the tiers
gohawk expects whoever wires it into CI to understand analyzer tiers and groups, and to manage defaults, groups, and experimental checks deliberately rather than treating every diagnostic as equally authoritative. The flags are real and granular (-enable, -disable, -enable-groups, -enable-checks, -enable-all, -tier), and that power cuts both ways. In step 4 I ran -enable-all expecting a flood of extra findings and got exactly zero new ones, because the only experimental analyzer in this build is about subprocesses my fixture never spawns. A team that treats -enable-all as “more is better” without reading gohawk list will either drown in noise on a different codebase or, like me, be surprised when nothing changes.
6. Introduced vulnerability: analyzing attacker-controlled code is a CI denial-of-service surface
This is the one that matters most to a security audience, and it is a property of static analyzers in general, not a gohawk-specific bug. If your CI runs gohawk over code from untrusted contributors (a public repo taking pull requests, say), then the analysis itself becomes an attack surface. A hostile contributor can craft a package layout or code path designed to force the analyzer into runaway CPU, memory, or time use, which is a denial-of-service against your build infrastructure. I did not build a malicious package graph to prove this; doing it responsibly needs more than a 30-minute lab. The mitigation is not gohawk-specific either: run untrusted analysis in an isolated runner with hard CPU, memory, and wall-clock limits, and use gohawk’s own -c concurrency control and dump budget to cap and observe cost. Treat “we run a static analyzer on PR code” as “we execute attacker-influenced work in CI,” because for resource purposes it is.
gohawk reports only what it can prove, and accepts missing some bugs as the cost. That tradeoff is called precision over recall: few false alarms, some missed bugs. I ran into the same one with Skylos a few weeks back, which proved three of the eight mistakes I planted and passed on five rather than flag things it could not be sure about. The lab shows where this choice pays off and where it costs you.
The 30-Minute Lab: four planted leaks the toolchain misses
The goal: build a small Go module where every package has one deliberate lifecycle bug, confirm the standard toolchain passes it clean, then see which bugs gohawk catches, how it explains them, and crucially why it makes the calls it does.
Everything here ran on a Mac (Go 1.27.3, arm64) against gohawk v0.7.2, the current release. The complete reproducer is in the page bundle: setup.sh, README.txt, and the four fixture files (main.go, metrics.go, pipeline.go, worker.go).
1. Building the lab
The shape of the module is not incidental, it is the experiment. gohawk reasons across package boundaries, and as you will see in step 5, which package a bug lives in changes the verdict. So the lab is one module with four packages, each isolating a single bug that maps to one gohawk analyzer:
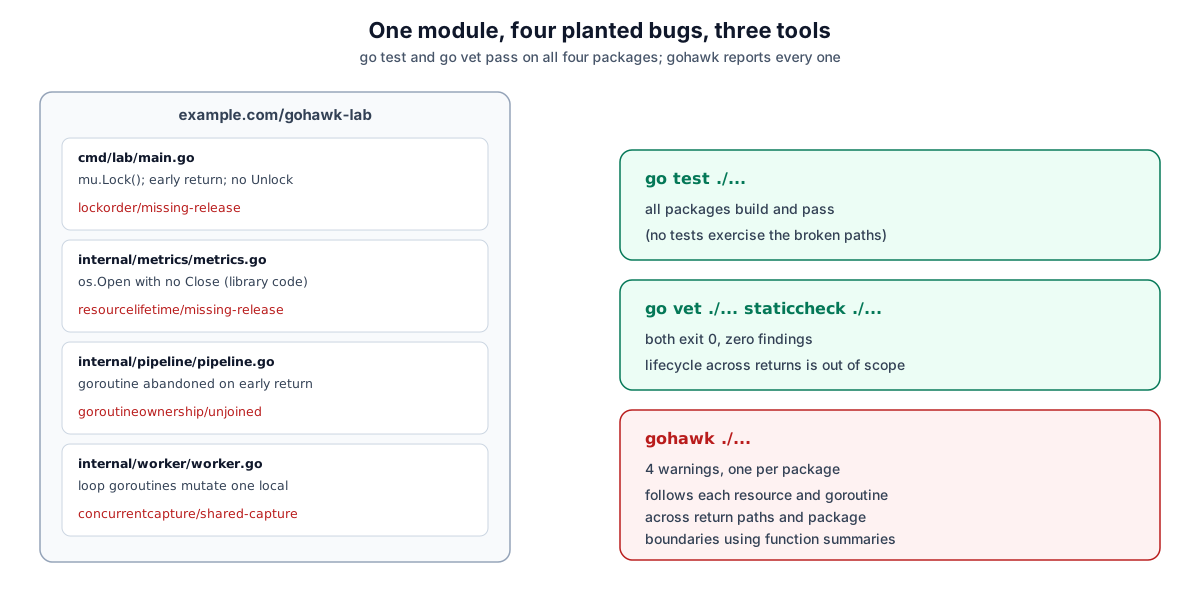
Install is a plain go install; gohawk is a normal Go binary with no runtime, no daemon, no external service. I put it in a local ./bin so the lab is self-contained and nothing touches my global toolchain:
mkdir -p gohawk-lab/cmd/lab gohawk-lab/internal/metrics \
         gohawk-lab/internal/pipeline gohawk-lab/internal/worker
cd gohawk-lab
go mod init example.com/gohawk-lab
GOBIN=$PWD/bin go install github.com/kojah/gohawk@latest   # installs gohawk v0.7.2
Now the four fixtures. Each is the smallest honest version of a bug I have actually shipped at some point in my life. First, cmd/lab/main.go, with a lock that an early return skips over:
var mu sync.Mutex
var unhealthy bool

func update() {
	mu.Lock()
	if unhealthy {
		return // BUG: returns while holding mu; the next caller deadlocks
	}
	fmt.Println("updated")
	mu.Unlock()
}

func main() {
	_, _ = metrics.FileSize("/etc/hosts")
	update()
}
Second, internal/metrics/metrics.go, a file handle opened and never closed. I put this in a library package on purpose, and that choice is the whole point of step 5:
// FileSize opens a file to stat it, but never closes the handle on any path.
func FileSize(path string) (int64, error) {
	f, err := os.Open(path)
	if err != nil {
		return 0, err
	}
	info, err := f.Stat()
	if err != nil {
		return 0, err // BUG: leaks f
	}
	return info.Size(), nil // BUG: leaks f here too
}
Third, internal/pipeline/pipeline.go, a goroutine the function is supposed to wait for but abandons on an early return. A sync.WaitGroup is Go’s standard “wait for these goroutines to finish” counter: Add before you start, Done when each finishes, Wait to block until the count hits zero.
func Run(fail bool) {
	var wg sync.WaitGroup
	wg.Add(1)
	go func() {
		defer wg.Done()
		work()
	}()
	if fail {
		return // BUG: returns without wg.Wait(); the goroutine is abandoned
	}
	wg.Wait()
}
Fourth, internal/worker/worker.go, the classic “launch goroutines in a loop that all scribble on the same variable.” A goroutine is Go’s lightweight concurrent task, started with the go keyword; when several of them write the same memory with no lock, that is a data race:
func Aggregate(items []int, sink chan<- int) int {
	var wg sync.WaitGroup
	total := 0
	for _, n := range items {
		wg.Add(1)
		go func() {
			defer wg.Done()
			total += n // BUG: concurrent mutation of a captured local
			sink <- n  // blocks forever if nobody drains sink
		}()
		if n < 0 {
			return total // BUG: abandons started goroutines; wg never waited
		}
	}
	wg.Wait()
	return total
}
Four packages, four bugs, each a lifecycle problem that only bites across a return path or under concurrency.
2. The baseline: the standard toolchain passes all of it
Before gohawk gets a turn, establish what the ordinary tools say, because the entire value proposition is “these pass and the bug still ships.” This is the step that makes the rest meaningful:
go test ./...        # exit 0
go vet ./...         # exit 0
staticcheck ./...    # exit 0 (staticcheck 2026.2.2)
All three are clean. go test reports [no test files] for every package and exits 0, which is honest: there are no tests, so nothing fails, exactly like a real codebase whose tests simply never exercise the unhealthy branch or the fail path. go vet (the checker built into Go) and staticcheck (a widely used third-party linter) both exit 0 with no output. They are not broken; catching “resource not released on every return path across package boundaries” is simply outside what they do. That clean result is the baseline: anything gohawk reports next is something your current checks did not.
3. The analyzer catalog
gohawk list prints what you are working with, and reading it is step one of using the tool responsibly (Reality Check #5):
ANALYZER               TIER          GROUP
concurrentcapture      core          concurrency
goroutineownership     core          concurrency
lockorder              core          concurrency
producerlifecycle      core          concurrency
cancellationownership  core          resources
deferinloop            core          resources
processownership       experimental  resources
resourcelifetime       core          resources

core runs by default; experimental requires selection (see -tier)
Two things to key on here. First, the tier column: seven analyzers are core and run by default, and exactly one, processownership, is experimental and only runs if you ask for it. That single experimental analyzer is why step 4’s -enable-all surprise happens. Second, the group column splits the analyzers into concurrency (locks, goroutines, captured variables, producer/receiver lifetimes) and resources (files, contexts, defers, subprocesses). You can enable or disable a whole group with -enable-groups/-disable-groups, which is how you would tune this for a codebase that, say, cares about resource leaks but runs its own goroutine conventions.
For reference, gohawk doc <name> prints what each one checks. The four this lab trips:
lockorder/missing-release: a lock that is not released on every return path.resourcelifetime/missing-release: an owned file, SQL handle, HTTP response, or compressor not released on every path.goroutineownership/unjoined: a goroutine with a recognizable join that is not honored on every return path.concurrentcapture/shared-capture: a local mutated by goroutines launched repeatedly in a loop.
4. The first run, and a surprise that sent me into the internals
The Rabbit Hole Generator’s original exercise used a single-file fixture (the file leak and the mutex bug both sitting in main) and told me to compare the default run against -enable-all and read off the difference. So I did exactly that first, and got a result that did not match the script:
$ gohawk ./...            # default (core) set
warning: lock `mu` is not released on this return path [lockorder/missing-release]

$ gohawk -enable-all ./...   # every analyzer and check
warning: lock `mu` is not released on this return path [lockorder/missing-release]

$ diff default enable-all
(no difference)
Two things were wrong versus what I expected. -enable-all added nothing, and the file-descriptor leak sitting right there in fileSize was never reported at all. The first one I could explain from step 3: the only analyzer -enable-all adds over the default is processownership, which checks that os/exec subprocesses are waited on, and this fixture never starts a subprocess. So “enable everything” genuinely changes nothing here. Good to know, and a tidy illustration of Reality Check #5: more flags is not more findings unless the code has something for those analyzers to find. (The Rabbit Hole Generator’s picks run off a backlog, so an exercise can be weeks old by the time I run it and a tool’s behavior may have moved on. Here the drift was in the expectation, not the tool.)
The missing file leak bothered me more. gohawk’s own docs say resourcelifetime checks owned files, so why was it silent on a textbook unclosed handle? Rather than shrug, I used gohawk’s evidence tracer, which exists precisely for this. gohawk dump trace -func fileSize ./cmd/lab prints every proof step the analyzer considered, and the last line was the answer:
decision accepted process-exit-reclaims acquisition=os.Open resource_type=*os.File
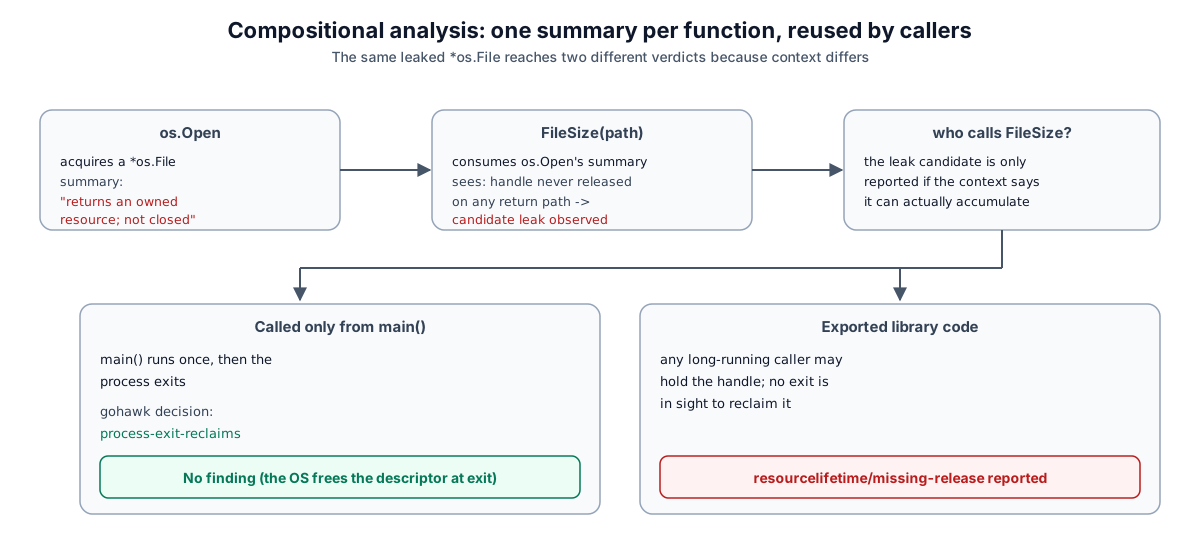
gohawk did see the leak. A few lines up, its trace records resource-return-path ... active=true released=false, meaning it proved the file is still open on a return path. Then it deliberately chose not to report it, with the reason process-exit-reclaims: fileSize is only reachable from main, and when main returns the process exits and the operating system reclaims every file descriptor the process held. A one-shot main that leaks a handle and immediately exits has not actually leaked anything that matters. So gohawk suppressed it to avoid a technically-true-but-useless warning. That is the compositional model (Reality Check #4) doing something smarter than pattern matching: the verdict depends on the context the function is called in, not just the function’s own body.
Which immediately raises the question: what if the same leak lived somewhere the process-exit escape hatch does not apply?
5. Making the leak real: the same code, a different verdict
This is why FileSize lives in a library package (internal/metrics) in the real lab, not in main. Library code can be called by anything, including a long-running server that never exits, so gohawk cannot assume a process exit will clean up after it. Same function body, different context. Here is the full four-package run:
$ gohawk ./...
warning: lock `mu` is not released on this return path [lockorder/missing-release]
  --> cmd/lab/main.go:16:3

warning: owned resource from os.Open is not released on every return path [resourcelifetime/missing-release]
  --> internal/metrics/metrics.go:6:12
   |
 6 | 	f, err := os.Open(path)
   | 	          ^~~~~~~~~~~~~
...
11 | 	if err != nil {
   | 	   ^~~~~~~~~~ when this is true
12 | 		return 0, err
   | 		^~~~~~~~~~~~~ returns here without releasing `f`
  = help: release it on every return path, usually with `defer` right after the error check

warning: goroutine is not joined on every return path [goroutineownership/unjoined]
  --> internal/pipeline/pipeline.go:10:2

warning: captured local total is mutated by goroutines launched repeatedly [concurrentcapture/shared-capture]
  --> internal/worker/worker.go:16:4
Moving the identical leak into a library package flipped the verdict from silence to a precise finding. The takeaway from this step is that gohawk is context-sensitive: the same code can be a reportable bug in one package and not in another. The diagram below shows the mechanism:
Worth keying on in the resourcelifetime output: it points at line 12, the error return (return 0, err), not the happy-path return, with the annotation “returns here without releasing f.” It flags the first unreleased path it proves. The fix it suggests, defer right after the error check, is the standard Go way and it closes every path at once, which is why gohawk recommends it over sprinkling f.Close() before each return. Fixing only the line the caret points at would leave the success path still leaking. Read the warning as “this resource is not deferred,” not “this one return is broken.”
6. The concurrency analyzers, and the bug gohawk refused to call
The goroutineownership and concurrentcapture warnings in that run are the headline “leaked goroutines” class. The pipeline.Run finding is clean and worth reading closely, because the machine-readable form is what you would actually consume in CI:
$ gohawk -json ./internal/pipeline/...
{
  "example.com/gohawk-lab/internal/pipeline": {
    "goroutineownership": [
      {
        "category": "goroutineownership/unjoined",
        "posn": ".../pipeline.go:10:2",
        "message": "goroutine is not joined on every return path",
        "related": [
          {
            "posn": ".../pipeline.go:15:3",
            "message": "returns here without waiting for the goroutine"
          }
        ]
      }
    }
  }
}
posn points at the go func() that starts the work, and related points at line 15, the return that abandons it. Use both when you wire gohawk into a pull-request check: the comment can name the goroutine and the exact line that walks away from it, instead of just saying something is wrong in the function.
Now the part I did not expect. My worker.Aggregate fixture has two bugs: goroutines in a loop mutating a shared total (a concurrentcapture problem) and an early return that abandons started goroutines (which looks like a goroutineownership problem). gohawk reported the first and said nothing about the second. Back to the tracer:
$ gohawk dump trace -func Aggregate ./internal/worker
  goroutineownership/unjoined at internal/worker/worker.go:14:3
    evidence   unknown  storage-address-escapes ... (*sync.WaitGroup).Add
    label      accepted direct-join at worker.go:23 ... (*sync.WaitGroup).Wait
    considered rejected join-proven
    decision   unknown  flag-guarded-join groups=2 owners=0 signals=0
  candidate  observed diagnostic-candidate message="captured local total is mutated ..."
gohawk found the wg.Wait() (the join) and then hit storage-address-escapes, which means a reference to something it was tracking leaves the function in a way the summary cannot follow. Here the WaitGroup’s address escapes, and the sink channel parameter carries ownership out of the function. So the analyzer reached a verdict of unknown for the goroutine-ownership question and reported nothing, while still confidently reporting the concurrentcapture bug it could prove.
That is Reality Check #2 happening in front of me. Ownership moved through a channel and the lifecycle became invisible to static analysis, so gohawk declined to rule rather than emit a finding it could not back. To confirm the analyzer is not simply blind to this bug class, I wrote the cleaner pipeline.Run version where ownership does not escape, and there it fired immediately (the warning in step 5). So the same kind of bug is reported when ownership is traceable and left unreported when it escapes. That is the precision-over-recall tradeoff described at the end of the Reality Check, and the one Skylos made too: some missed bugs in exchange for very few false alarms.
7. Fixing them, and confirming the quiet
A finding is only useful if the fix is obvious and verifiable. Each warning came with the standard fix, so I applied all four: defer mu.Unlock() right after the lock, defer f.Close() right after the error check, defer wg.Wait() so the join runs on every path, and in the worker a per-goroutine copy plus a mutex around total. Then the tell:
$ gohawk ./...
$ echo $?
0
No output and exit code 0 means clean. In CI, the exit code is what the check looks at: non-zero means findings. The fixes were ordinary Go idioms, the same ones a code reviewer would ask for, so nothing had to be restructured to satisfy the tool.
Where this fits in a real environment
gohawk fits as a CI check on long-running Go services, such as network daemons and API servers, that open files and sockets, start goroutines, and hold locks. It complements go vet and staticcheck rather than replacing them (step 2). Three of the Reality Check points decide whether it is enough for your situation: cost on a very large repository (#1), code where ownership passes through channels or interfaces, where a quiet run does not mean safe (#2, lab step 6), and running it on untrusted pull requests (#6).
Actionable Takeaways
To try this on your own service:
- Install and run it from your module root.
go install github.com/kojah/gohawk@latest, thengohawk ./.... A non-zero exit code means findings. - Run it through the toolchain you already use.
go vet -vettool=$(command -v gohawk) ./...runs it as ago vettool, and agolangci-lintplugin build (golangci-lint is a popular Go lint runner) is also available. - When a result surprises you, ask the tracer.
gohawk dump trace -func <function name> ./<package path>shows why gohawk reported or suppressed something, as in steps 4 and 6. - Before adding it to CI on a big repository, check the cost. Run
gohawk dump budget ./...and time a full run. If the code comes from outside contributors, run the analysis in an isolated runner with CPU, memory, and time limits, and use the-cflag to cap concurrency.
