Nobody reviews their cloud configuration by hand. There is too much of it, it changes under you, and the dangerous mistakes (a storage bucket opened to the world, an admin account with no second factor, a node agent that will answer anonymous requests) don’t announce themselves. Vulnerability scanners don’t help much here either; they look at the software running on a host, not at whether the host’s own control plane is set up the way it should be. That gap is what posture management tools exist to fill: pull the configuration out of the cloud APIs, compare it against a published checklist, and tell you what fails.
The Rabbit Hole Generator handed me cloudbeat this week, which is Elastic’s open-source collector for exactly that job. Its challenge was deliberately modest: audit the policy files in the repo without any cloud credentials. I did that, and it was more interesting than it sounds. But I also had a Kubernetes cluster and a spare AWS account sitting right there, so I went further and ran the real thing: a scan of my own cluster through my own infrastructure-as-code, and a scan of an AWS account through a connection that never involved an access key.
The scores came back concrete, 79% for the cluster and 34% for the AWS account. The part worth your thirty minutes is the question underneath both numbers: 79% of what? A posture score is only as current as the benchmark it grades against, and the benchmark edition is right there in the product if you know where to look. This post is about where to look, what the two scans actually found, and what the tool quietly holds in exchange. And since both targets are mine, it ends with the part dashboards never show: how much work the two numbers actually represent.
What is cloudbeat used for in cloud security posture management?
cloudbeat is Elastic’s open-source, Go-based collector for Cloud Security Posture Management (CSPM) and Kubernetes Security Posture Management (KSPM). It discovers resources through cloud-provider and Kubernetes APIs, evaluates each one against versioned security policies derived from the Center for Internet Security (CIS) Benchmarks, and writes one finding document per rule and resource into Elasticsearch. It ships inside Elastic Agent and is managed through Fleet, and the Cloud Security Posture dashboard in Kibana turns the findings into per-benchmark compliance scores. It is a collector and evaluator, not a standalone product: without an Elastic deployment to send findings to, it has nowhere to put its results.
The Architecture: a Beat that grades instead of ships
A few terms up front, because this tool sits at the intersection of three specialist areas.
- CSPM / KSPM are the industry labels for continuously checking cloud and Kubernetes configuration (not software vulnerabilities) against a hardening standard. The “posture” is the sum of those configuration choices.
- The CIS Benchmarks are the standard almost every posture tool grades against: consensus-built, numbered checklists per platform (“1.12 Ensure credentials unused for 45 days or more are disabled”), published by the Center for Internet Security and revised in versioned editions.
- A Beat, in Elastic’s world, is a small single-purpose data shipper (Filebeat ships logs, Metricbeat ships metrics).
cloudbeatis built on the same framework, but what it ships is judgments: it fetches configuration, evaluates it, and sends the verdicts. - Elastic Agent and Fleet are the wrapper and the control plane. One Elastic Agent process runs several Beats, and Fleet (a Kibana app) tells enrolled agents which integrations to run and with what settings. You never run
cloudbeatby hand; you add a “Security Posture Management” integration to an agent policy and Fleet does the rest.
The design’s one real architectural bet is the separation of three stages that opaque CSPM services usually fuse together:
- Collect. For Kubernetes,
cloudbeatruns as a DaemonSet (one pod per node, a standard Kubernetes pattern) and reads the cluster API plus the host’s own files: the kubelet’s process arguments, its config file, the files under/etc/kubernetes. For AWS, it calls the account’s APIs with read-only permissions, enumerating IAM users, S3 buckets, security groups, CloudTrail, and so on. - Evaluate. Every resource is run through policies written in Rego, the language of the Open Policy Agent (OPA), a general-purpose policy engine. Each CIS rule is one Rego package with its metadata and tests alongside it.
- Emit. The result is one document per rule per resource, with
result.evaluationset topassedorfailed, written to an Elasticsearch data stream. Kibana does nothing clever; the score on the dashboard is just passes divided by passes plus fails, per benchmark.

That separation is the pitch: inspectable policy files in a public repo, raw findings you can query, and a deployment you can automate, instead of a vendor portal that shows you a number. The lab takes the pitch at its word and goes looking at those policy files first, before trusting a single score.
How the pieces fit
Three things decide what a cloudbeat deployment actually checks, and they are worth knowing before you run one.
The benchmark selector. The agent policy carries one setting, config.v1.benchmark, and the Go code is strict about it. In internal/config/benchmark.go the allowed values are a fixed list, SupportedCIS = {cis_aws, cis_k8s, cis_eks, cis_gcp, cis_azure}, and internal/config/config.go refuses to start with anything else:
if c.Benchmark != "" {
    if !isSupportedBenchmark(c.Benchmark) {
        return c, launcher.NewUnhealthyError(fmt.Sprintf("benchmark '%s' is not supported", c.Benchmark))
    }
}
So there is no “run the latest CIS” option. You get whichever edition of each benchmark the repo was built from, and nothing in the UI tells you to ask which one that is.
The policy bundle. Under security-policies/bundle/compliance/ there is one directory per benchmark, and inside it one package per rule:
cis_k8s/rules/cis_4_2_3/
├── data.yaml    # rule metadata: id, section, description, remediation
├── rule.rego    # the check itself
└── test.rego    # its unit test
The data.yaml is what ends up in the finding document’s rule.* fields, which is why every finding in Kibana carries its own remediation text. The metadata is generated from CIS’s own spreadsheets by scripts in security-policies/dev/, and those spreadsheets are checked into the repo, which turns out to be the most useful fact in this whole post.
The two deployment shapes. KSPM has to run inside the cluster it grades, so it is always an agent (the DaemonSet). CSPM only needs API access, so Elastic offers two ways: an agent you run yourself with cloud credentials, or an “Elastic Managed Integration” where Elastic’s own infrastructure assumes a role in your account and you run nothing. I used the agent for Kubernetes and the managed connector for AWS, which let me try both the self-hosted and the keyless story in one week. Per Elastic’s docs, KSPM re-evaluates every four hours and CSPM every 24 hours.
The Reality Check: where this breaks
That is the architecture’s promise: separable, inspectable, scriptable posture. Every week, the Rabbit Hole Generator also writes a critique of its pick, the places it is likely to fail at scale, the assumptions it leans on, and the security hole it opens. Here is that critique point by point, because knowing where a tool breaks is what tells you where to trust it.
The critique of cloudbeat had six distinct points, in three groups:
- Points 1 to 3 are about scale. I tested 2 and 3 directly, because a single small account and a three-node cluster were enough to show both. Point 1 needs a large multi-account estate, which I can’t fake honestly; I say what the code and cadence imply.
- Points 4 and 5 are assumptions the design makes. Both were testable, and both turned out to be exactly as stated.
- Point 6 is the vulnerability the tool itself introduces. I tested it against my own deployment and only my own.
1. Full re-enumeration can lose the race with drift
Every evaluation cycle walks every resource again through provider APIs that are paginated and rate-limited. At the scale of hundreds of accounts, a cycle can take longer than the interval between configuration changes, so the dashboard describes a state that no longer exists. I could not test this on one account with 106 resources, where a cycle is minutes. What I can say is that the cadence is fixed by Elastic (daily for CSPM, four-hourly for KSPM), there is no incremental mode in the code I read, and the only knob is how many agents you run. Treat the posture score as a periodic sample, not a live feed.
2. Finding cardinality inflates the index (tested)
The output is one document per rule per resource per cycle, and some rules are evaluated per region or per node. My three-node cluster produced 951 findings on its own, and the AWS account’s Monitoring section turned out to be a single rule failing 32 times, once per region (lab step 4). That is a small lab. Multiply by a fleet and by a daily history, and the storage, shard count, and query latency the critique warns about are the obvious consequence. Elastic mitigates with a “latest” index that holds only the most recent evaluation per rule and resource, which is what the dashboard reads; the full history is the expensive part.
3. One policy version across many places (tested)
Rolling integrations, credentials, and policy versions out to many clusters and regions is an upgrade-coordination problem, and the critique is right that it gets tight. The sharper version of this, which the lab found by accident, is that you don’t choose the policy version at all. The benchmark edition is baked into the release, every deployment grades against the same one, and that edition can be years behind CIS’s current publication (lab step 2 and lab step 5). Consistency, in other words, is solved by not offering a choice, and the cost is staleness nobody surfaces.
4. It assumes broad, continuous read access (tested)
It does, and it is explicit about it. On AWS the connector is granted the AWS-managed SecurityAudit policy: 1,082 allowed actions at the version I checked, every one of them a describe, list, or get (lab step 4). In the cluster the DaemonSet gets a ClusterRole with get, list, and watch over nodes, pods, services, config maps, service accounts, roles, and role bindings, plus read-only mounts of /etc, /var/lib, and /proc on every node. Nothing writes. But “read-only” and “harmless” are different words, which is point 6.
5. It assumes you operate, or accept, the Elastic Stack (tested)
Also true, and worth being honest about. The Rabbit Hole Generator’s title for this week was “open CSPM without the SaaS black box,” and the collector is open. But findings have nowhere to go except Elasticsearch, the dashboard is Kibana, and the keyless AWS connector only exists as an Elastic-hosted service. I ran this on a 14-day Elastic Cloud serverless trial because self-hosting a stack big enough to be useful on my cluster would have evicted the workloads I actually care about. The open part is the policy and the data format; the operating model is still “bring an Elastic deployment.”
6. Introduced Vulnerability: the scanner is a map of everything (tested)
Every posture tool concentrates read access to the whole environment in one place, and cloudbeat is no exception. Compromise the DaemonSet’s pod, its node, or the agent’s enrollment, and you hold a root process on every node with the host filesystem mounted and a cluster-wide view of RBAC and workloads. Compromise whatever holds the Elastic side of the AWS trust, and you can assume a role that reads IAM, network, and storage configuration across the entire account. None of that lets an attacker change anything. All of it tells them exactly what to change, where the gaps are, and which account has no MFA. Lab step 3 and lab step 4 show the actual privilege each half holds, read straight from the manifest and the CloudFormation template rather than from the docs.
The 30-Minute Lab: audit the policies, then run the scan for real
The Rabbit Hole Generator’s challenge was a policy provenance inventory: clone the repo, count and hash everything under security-policies/, and trace where the Go code loads it, all without cloud credentials. I did that in step 2. Then I used what it turned up to read two real scans with the right amount of skepticism: my own Kubernetes cluster through KSPM (step 3) and an AWS account through the keyless CSPM connector (step 4), and finally the question of which benchmark edition the scores are against (step 5).
One note on drift before starting. This week’s pick is a backlog item from a few weeks ago, and the repo moves fast (3,469 commits on main when I cloned it). Everything below was run on commit 0507f75 from the day I wrote this; where the tool differs from the Notion-era challenge I say so.
1. Building the lab
Three pieces, in the order they have to exist.
The Elastic side. A serverless Security project on Elastic Cloud (the 14-day trial). “Serverless” here means Elastic runs Elasticsearch and Kibana and I get a URL; there is no cluster of mine to size. One consequence I hit immediately: the trial deployment landed on GCP, and Elastic’s older agentless path for AWS requires Kibana itself to be hosted on AWS. That is why the AWS half below uses the newer federated-identity connector rather than the one the docs describe first. If you are following along, pick AWS as the region when you create the project and you get both options.
The Kubernetes target. My own three-node DigitalOcean Kubernetes cluster, the one I rebuilt during the cloud migration series. Everything on it is managed by Terraform in a repo whose CI applies on push, so KSPM had to go in the same way, not via a kubectl apply I would forget about. I’ll show the Terraform in step 3.
The AWS target. A single free-tier account with nothing much in it: a default VPC, a few IAM users left over from CI experiments, no EC2 running. That is deliberate. CSPM is read-only API calls, which AWS does not bill for, and I wanted a scan that would cost nothing and still have plenty to fail. (It did: 121 failures across 106 resources.) I kept it to CSPM only; Elastic’s vulnerability scanning, CNVM, snapshots EBS volumes, which is where a “free” lab stops being free.
The policy audit needs none of the above; it is a clone and one Python script. I ran the script inside a container with the repo mounted read-only, because it is downloaded code, and I’d rather it not have write access to anything:
git clone --depth 1 https://github.com/elastic/cloudbeat.git repo
mkdir -p out
docker run --rm -v "$PWD/repo:/repo:ro" -v "$PWD/inventory.py:/inventory.py:ro" \
  -v "$PWD/out:/out" -w /repo python:3.12-slim python3 /inventory.py /out
inventory.py is the Rabbit Hole Generator’s script with one change: it takes an output directory as an argument instead of writing to /tmp, so it works from inside the container. The complete set of files from this lab is in the bundle: the inventory script, the Terraform for the DaemonSet with its variables, the CloudFormation template Elastic ships for the AWS role, and the exact failing rules the cluster scan produced.
2. The policy audit, or what a posture score is made of
The script walks security-policies/, counts files by extension, greps each one for provider names, and writes a manifest with a SHA-256 for every file. Here is the summary it printed:
{
  "policy_root_exists": true,
  "file_count": 1101,
  "total_bytes": 3446429,
  "extensions": {
    ".rego": 762, ".yaml": 322, ".xlsx": 5, ".py": 4, ".md": 3, ...
  },
  "files_mentioning_provider": {
    "aws": 241, "azure": 238, "gcp": 237, "kubernetes": 255
  }
}
Two things to key on. The 762 .rego files are the actual checks (and their tests), and the per-provider counts being nearly equal says coverage is broad rather than AWS-first. Counting rule packages per benchmark directly gives the real shape: cis_k8s 185 Rego files, cis_azure 146, cis_gcp 144, cis_aws 112, cis_eks 64. The repo’s own RULES.md turns those into coverage against the benchmark: for Kubernetes, 92 of 125 CIS rules implemented (74%), with the automated ones at 99% and the manual ones (rules CIS itself says need a human) at 37%. That last number matters when you read a score later: a “pass” rate is computed over the rules the tool implements, not over the whole benchmark.
Then the part I did not expect. The script lists the ten largest files, and the top of the list is not policy at all:
   520563  security-policies/dev/input/CIS_Microsoft_Azure_Foundations_Benchmark_v2.0.0.xlsx
   498501  security-policies/dev/input/CIS_Amazon_Web_Services_Foundations_Benchmark_v1.5.0.xlsx
   148844  security-policies/RULES.md
   121360  security-policies/dev/input/CIS_Google_Cloud_Platform_Foundation_Benchmark_v2.0.0.xlsx
    65131  security-policies/dev/input/CIS_Kubernetes_V1.23_Benchmark_v1.0.1.xlsx
    52528  security-policies/dev/input/CIS_Amazon_Elastic_Kubernetes_Service_(EKS)_Benchmark_v1.0.1.xlsx
Those are the CIS source spreadsheets the rule metadata is generated from, and their filenames carry the edition: AWS Foundations v1.5.0 and Kubernetes v1.0.1 (the edition written for Kubernetes 1.23). Hold on to those two version strings; step 5 is about them.
The manifest itself is the deliverable the challenge was after:
json: valid
manifest sha256 (prefix): a01b5fde297f6cdb
Check that file into CI next to a pinned cloudbeat version and you have a tripwire: if the hash of the policy tree changes between two builds, somebody changed what “compliant” means and you want to know. It is a small idea, and it is the kind of thing an open policy repo makes possible and a SaaS portal does not.
Last, the challenge asked where the Go code touches the policies. git grep over *.go for benchmark|security-policies|rule finds the coupling in about a dozen lines, the important ones being the SupportedCIS list and the unhealthy-on-unknown check quoted in the Architecture section, plus internal/dataprovider/providers/rule_ecs/, which is where each finding gets its rule.* metadata attached before it is sent. That is the whole chain: a benchmark name in config selects a directory of Rego, and every verdict carries its rule’s YAML along with it.
3. KSPM: grading my own cluster, through Terraform
Adding the KSPM integration in Kibana (Integrations → Security Posture Management → KSPM → Self-Managed) creates an agent policy and offers a Kubernetes manifest to kubectl apply. I read the manifest instead of applying it, for two reasons. First, my cluster is Terraform-managed and applied from CI, and a hand-applied DaemonSet would be invisible drift. Second, the manifest has the Fleet enrollment token pasted into it as a plain environment variable, and a token in a YAML file has a way of ending up in a repo. It is the same mistake, in a different costume, as the hardcoded salt in last Tuesday’s flow-log sanitizer: the secret that the whole design depends on, sitting in source.
So the DaemonSet became native Terraform resources, and the token moved into a sensitive variable sourced from a CI secret, then into a Kubernetes Secret, then into the pod by reference. The relevant part of elastic-agent-kspm.tf:
resource "kubernetes_secret_v1" "elastic_agent_fleet_token" {
  metadata { name = "elastic-agent-fleet-token"  namespace = "kube-system" }
  type = "Opaque"
  data = { "enrollment-token" = var.fleet_enrollment_token }   # sensitive = true
}

# inside the DaemonSet's container block:
env {
  name = "FLEET_ENROLLMENT_TOKEN"
  value_from {
    secret_key_ref {
      name = kubernetes_secret_v1.elastic_agent_fleet_token.metadata[0].name
      key  = "enrollment-token"
    }
  }
}
The token never appears in the repo, terraform plan prints it as (sensitive value), and the state file that does hold it is encrypted at rest. The pattern is the one from Kubernetes Secrets Management, applied to a secret the vendor’s own tooling wanted me to paste.
Two setup nuances from writing it. The provider’s resource is kubernetes_daemon_set_v1, with an underscore; I typed daemonset and terraform validate was polite enough to suggest the fix. And the rest of the manifest is not small: tolerations for control-plane nodes, hostNetwork: true, runAsUser: 0, and twelve host-path mounts (/proc, /etc, /var/lib, /var/log, /sys/kernel/debug, /boot, and more), several of which the manifest’s own comments say are only needed for other Elastic integrations. I kept them all so the deployment matched what Elastic generates; for a production rollout I would prune to the ones KSPM uses. Read the full file; the privilege list is the point of Reality Check 6.
CI applied it, and the agents came up in under two minutes:
$ kubectl -n kube-system get daemonset elastic-agent
NAME            DESIRED   CURRENT   READY   UP-TO-DATE   AVAILABLE   AGE
elastic-agent   3         3         3       3            3           87s

$ kubectl -n kube-system exec elastic-agent-hvgq4 -- elastic-agent status
┌─ fleet
│  └─ status: (HEALTHY) Connected
└─ elastic-agent
   └─ status: (HEALTHY) Running
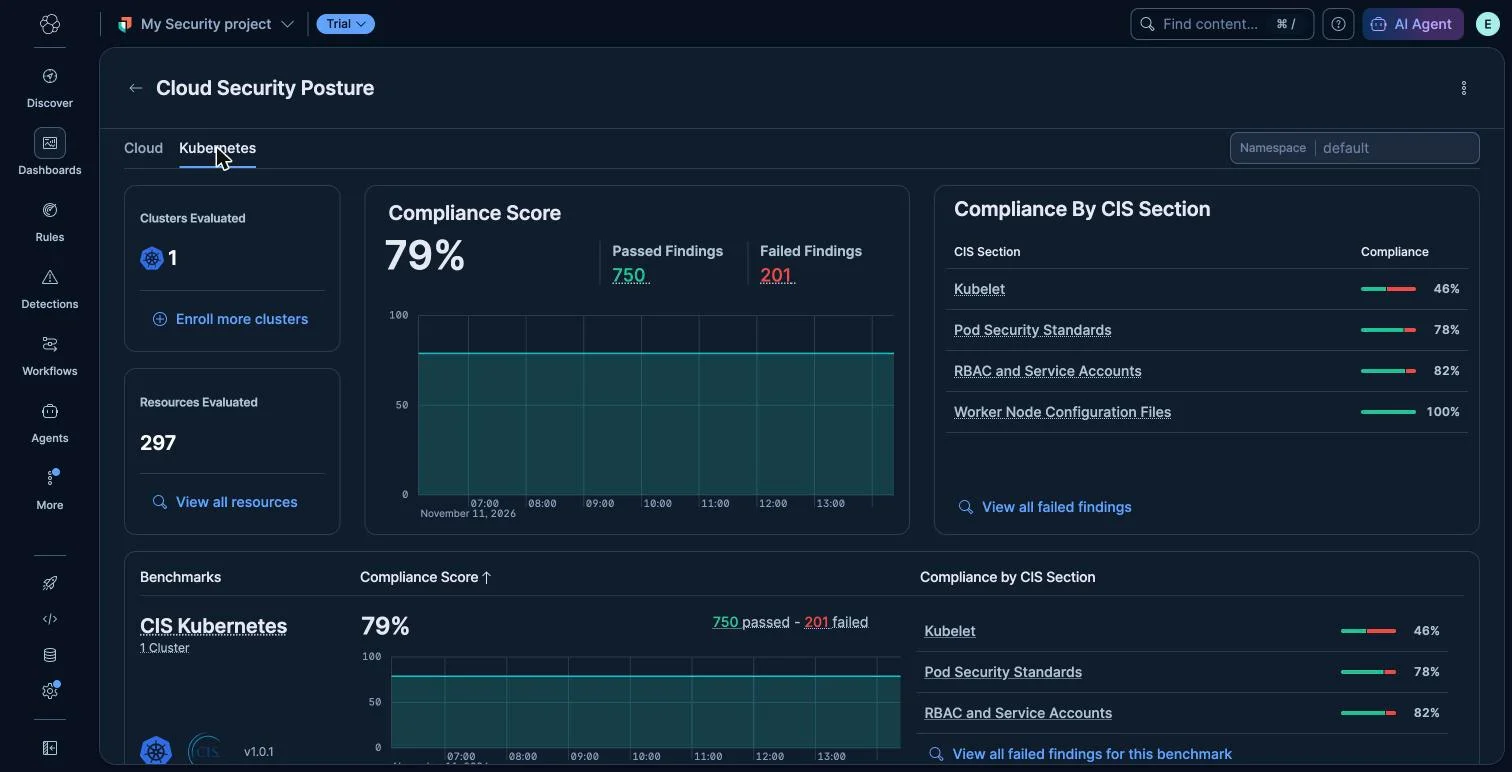
Connected is the line that matters: the enrollment token worked, the agent is talking to Fleet, and Fleet has handed it the KSPM policy. Findings appeared on the dashboard within about fifteen minutes, and the Kubernetes tab settled at 79% compliant: 750 passed, 201 failed, 297 resources across one cluster.

Now the reading. The section breakdown is the first thing to look at, and Kubelet at 46% stands out against Worker Node Configuration Files at 100%. Clicking through to the failed findings and grouping by rule.section shows the 201 failures split Pod Security Standards 103, RBAC and Service Accounts 77, Kubelet 21:
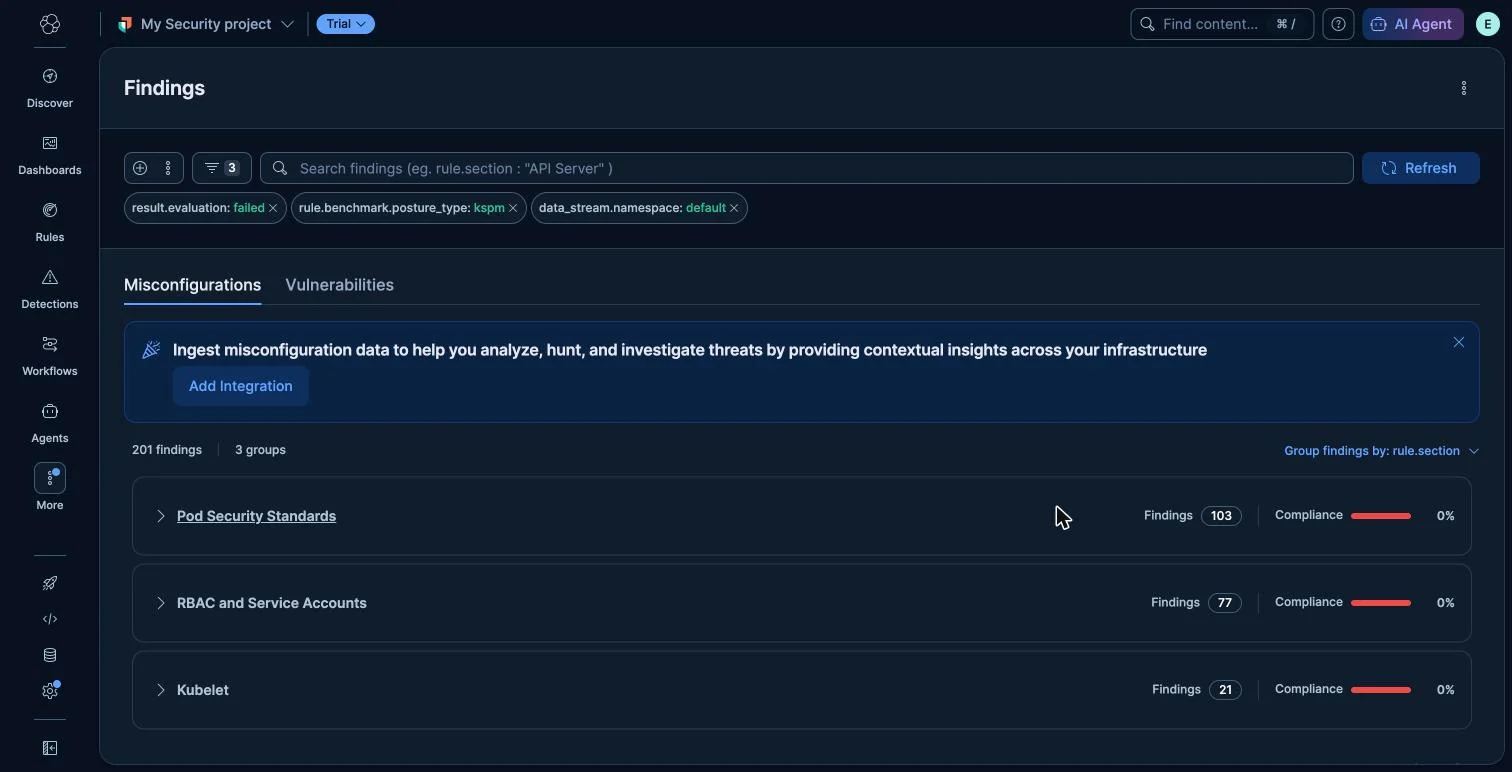
Expanding Kubelet is where the tool earns its keep, because the 21 failures are the same seven rules on each of the three nodes:
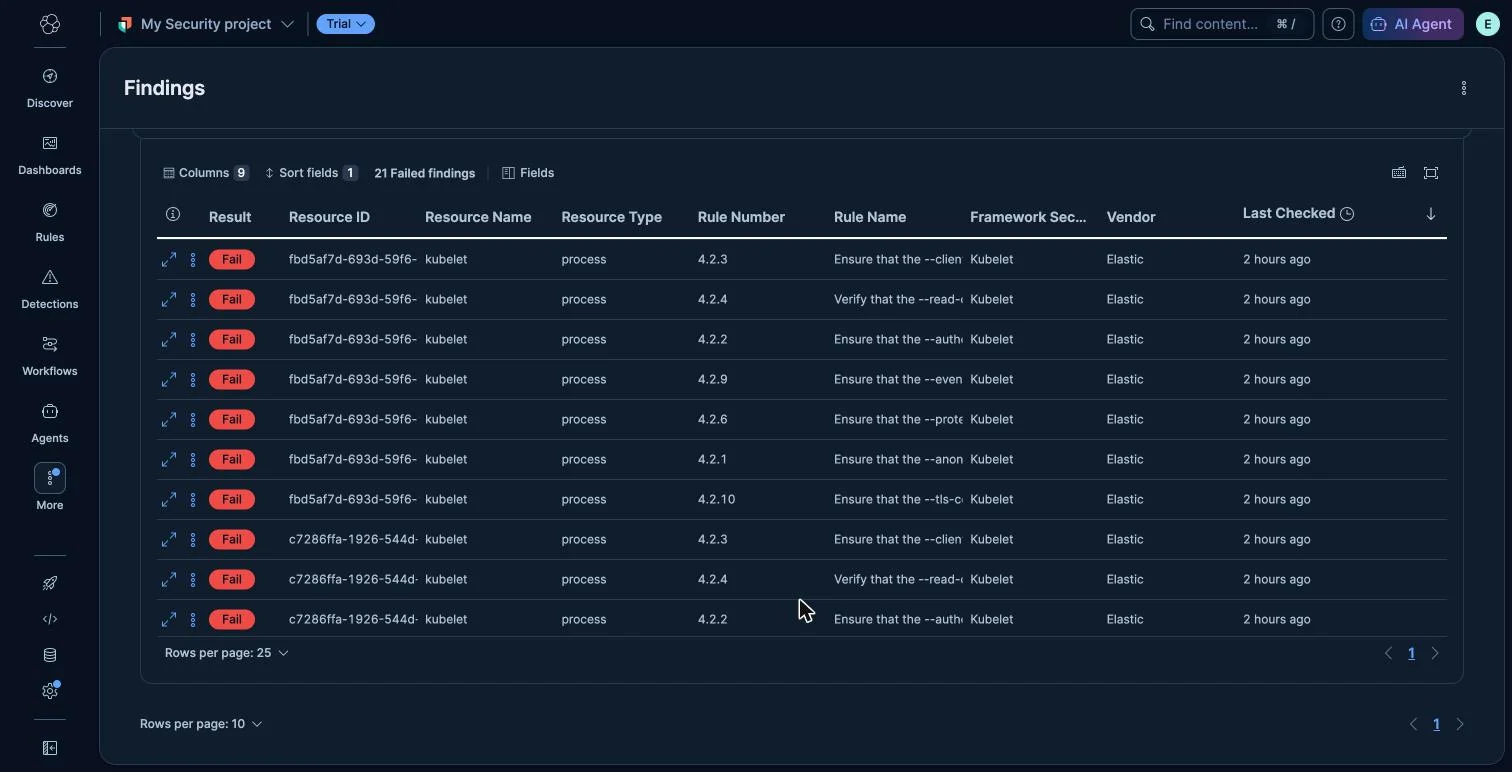
| CIS rule | What it checks |
|---|---|
| 4.2.1 | --anonymous-auth is false |
| 4.2.2 | --authorization-mode is not AlwaysAllow |
| 4.2.3 | --client-ca-file is set |
| 4.2.4 | --read-only-port is 0 |
| 4.2.6 | --protect-kernel-defaults is true |
| 4.2.9 | --event-qps is 0 or a sensible rate |
| 4.2.10 | --tls-cert-file and --tls-private-key-file are set |
Those are all kubelet flags. The kubelet is the agent on every Kubernetes node that actually starts and stops containers, and its own API is the classic thing you don’t want reachable anonymously. On a managed cluster like DigitalOcean’s, I do not control these flags; the provider does. So the useful question is not “how do I fix this” but “is the tool reading the real configuration, or guessing?” The finding document answers it. Opening one finding and switching to its JSON tab shows the collector and what it looked at:
"agent":   { "type": "cloudbeat", "version": "9.5.6", "name": "pool-4gb-3ed7ow" },
"process": { "args": [ "/usr/bin/kubelet",
                       "--config=/etc/kubernetes/kubelet.conf",
                       "--kubeconfig=/etc/kubernetes/kubelet.kubeconfig",
                       "--bootstrap-kubeconfig=/etc/kubernetes/bootstrap.kubeconfig",
                       "--node-labels=doks.digitalocean.com/..." ] }
That is the live kubelet command line from my node, captured through the /proc mount, with the config file path it points at. cloudbeat evaluated the 4.2.x rules against the actual process and its actual config, not a template of what DigitalOcean probably does. The fields to key on in any finding are agent.type (which component produced it), result.evaluation, rule.section, and rule.benchmark.version, and the raw process or resource block if you want to check the tool’s work, which here I could.
Every finding also carries its remediation text from the rule’s data.yaml:
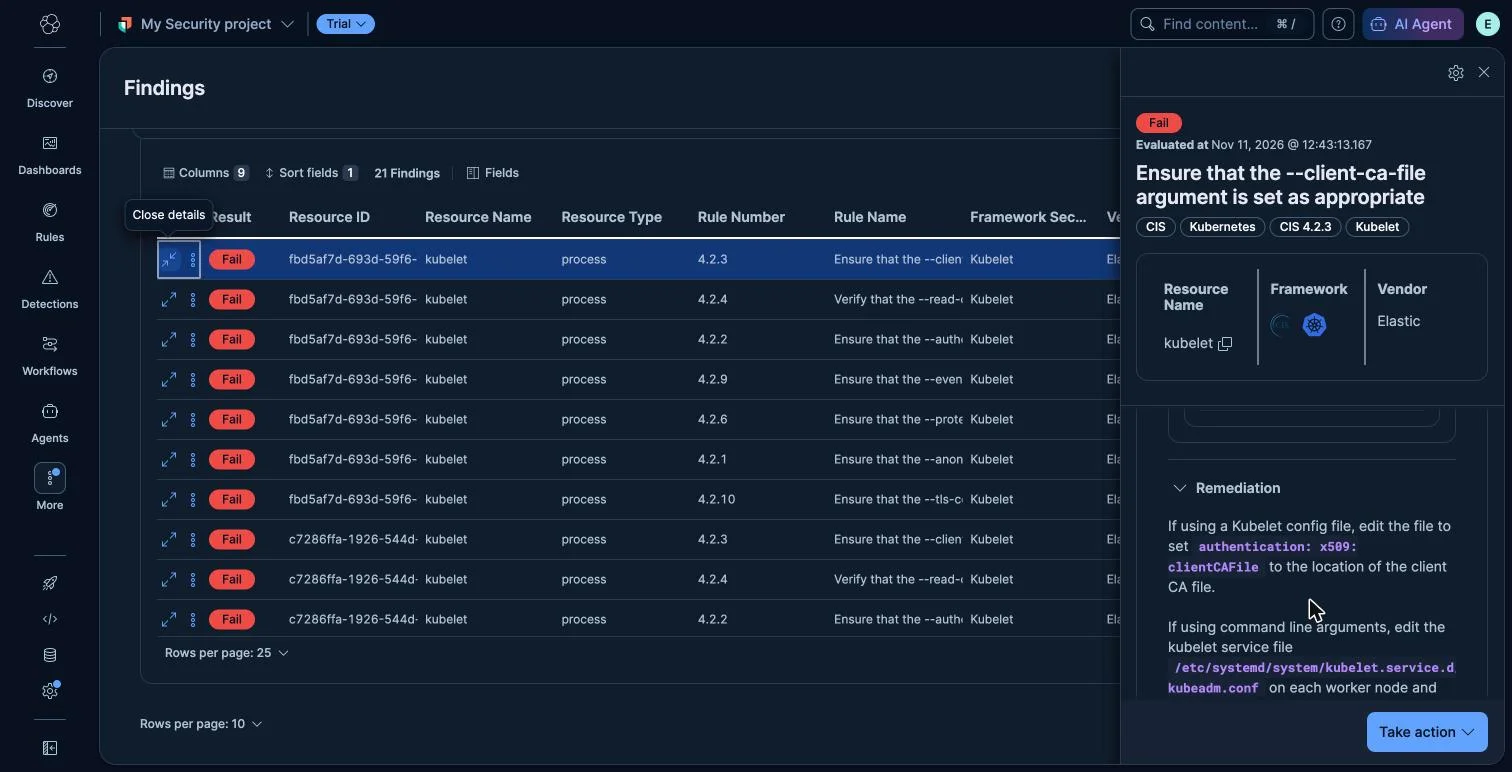
For 4.2.3: set authentication.x509.clientCAFile in the kubelet config, or edit the kubelet systemd drop-in on each worker node and restart it. Good advice for a cluster you built. For a managed one, these seven are a conversation with the provider, or an accepted exception, and the honest reading of “46% on Kubelet” is “the provider’s kubelet defaults disagree with the 2022 edition of the benchmark on seven flags.”
4. CSPM: grading an AWS account with no access key anywhere
The AWS half was the part I most wanted to get right, because CSPM tools are usually set up by pasting an access key and secret into a form, and that key then lives in the vendor’s system forever. Elastic’s “Elastic Managed Integration” with Federated Identity avoids that: you create an IAM role in your account that trusts a principal in Elastic’s account, Elastic assumes it when it is time to scan, and no long-lived credential exists on either side.
The wizard (Integrations → Security Posture Management → CSPM → AWS → Single Account → Elastic Managed → Federated Identity) ends in a Launch CloudFormation button. Before launching anything that creates IAM resources, I read the template it points at. The whole thing is 1.6 KB and creates exactly one resource:
Resources:
  ElasticCloudConnectorsRole:
    Type: AWS::IAM::Role
    Properties:
      RoleName: !Sub ElasticCloudConnectorsRole-${AWS::StackName}
      AssumeRolePolicyDocument:
        Statement:
          - Effect: Allow
            Action: sts:AssumeRole
            Principal:
              AWS: !Ref ElasticRoleARN          # default: arn:aws:iam::254766567737:role/cloud_connectors
            Condition:
              StringEquals:
                sts:ExternalId: !Join ["-", [!Ref ElasticResourceId, <uuid from the stack id>]]
      ManagedPolicyArns:
        - arn:aws:iam::aws:policy/SecurityAudit
Three things to understand in that block, because together they are the entire security model of the keyless connector.
- The principal is a role in Elastic’s AWS account,
254766567737. That is who is allowed to become this role. It is Elastic’s shared connector identity, not something unique to me. - The External ID is what makes it unique to me.
sts:ExternalIdis AWS’s standard defense against the confused deputy problem: if a vendor’s single identity can assume roles in many customers’ accounts, a customer could trick the vendor into assuming another customer’s role. The External ID, built from my Elastic resource ID and the CloudFormation stack’s UUID, is a value only my Elastic project knows, so Elastic can only assume this role on my behalf. The template outputs it, and it goes back into the Kibana form along with the role ARN. - The permissions are one AWS-managed policy,
SecurityAudit, and no inline policies. The template does not say that is read-only, so I pulled the policy document (version 94, last edited September 2026) and checked:
total Action entries: 1082
mutating verbs (Create|Put|Delete|Update|Modify|Attach|Detach|Run|Start|Stop|Write|Set|Enable|Disable|Terminate): none
Every one of the 1,082 actions is a describe, list, get, or lookup. Read-only is not a marketing word here; it is checkable, and I checked it.
I clicked Create Stack, the role appeared in under a minute, and the integration showed “Waiting for managed integration connection… this could take several minutes” while Elastic’s side assumed the role for the first time. Within about ten minutes the Cloud tab had a score: 34% compliant, 63 passed, 121 failed, 106 resources.
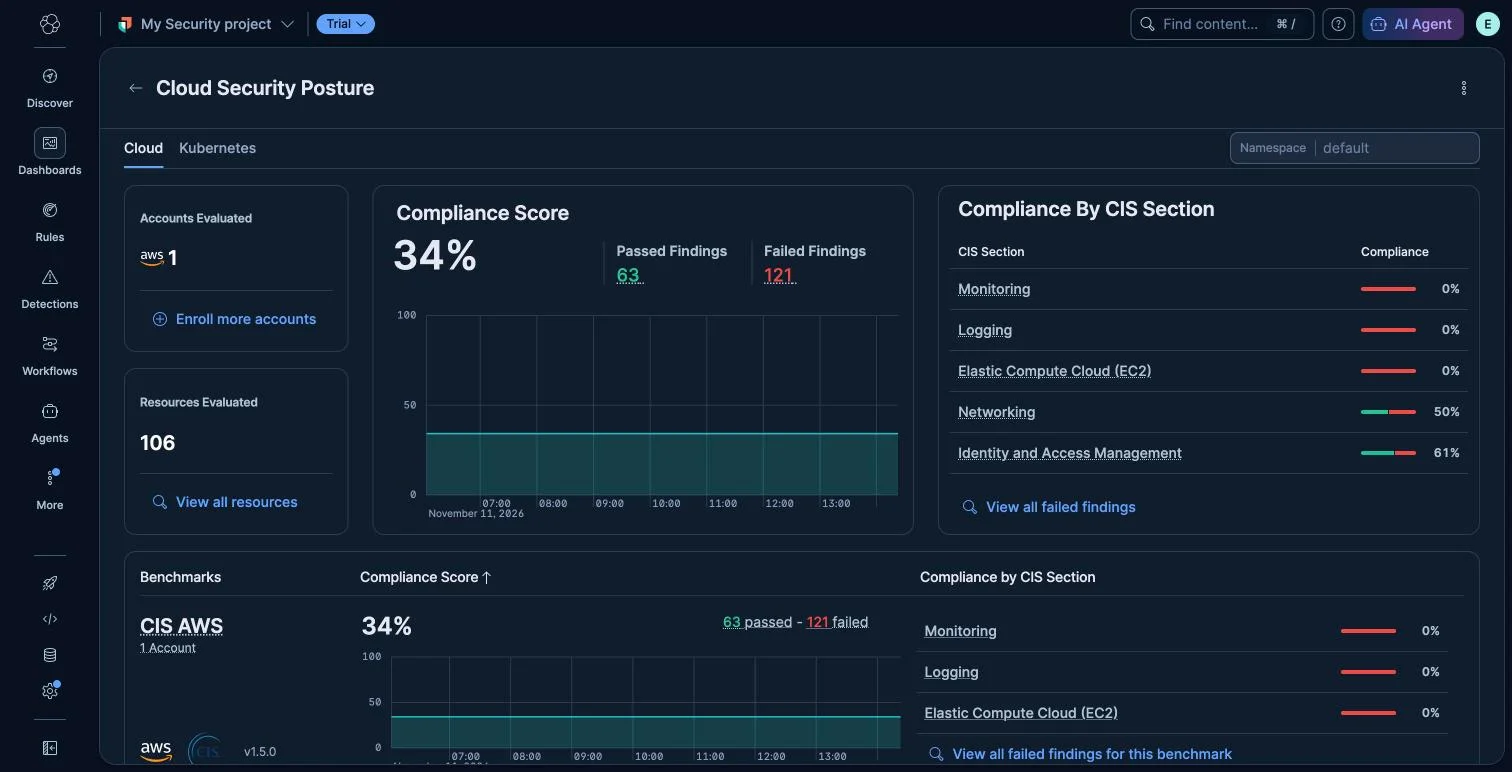
Three sections at 0% looks alarming until you group the 121 failures by rule.section:
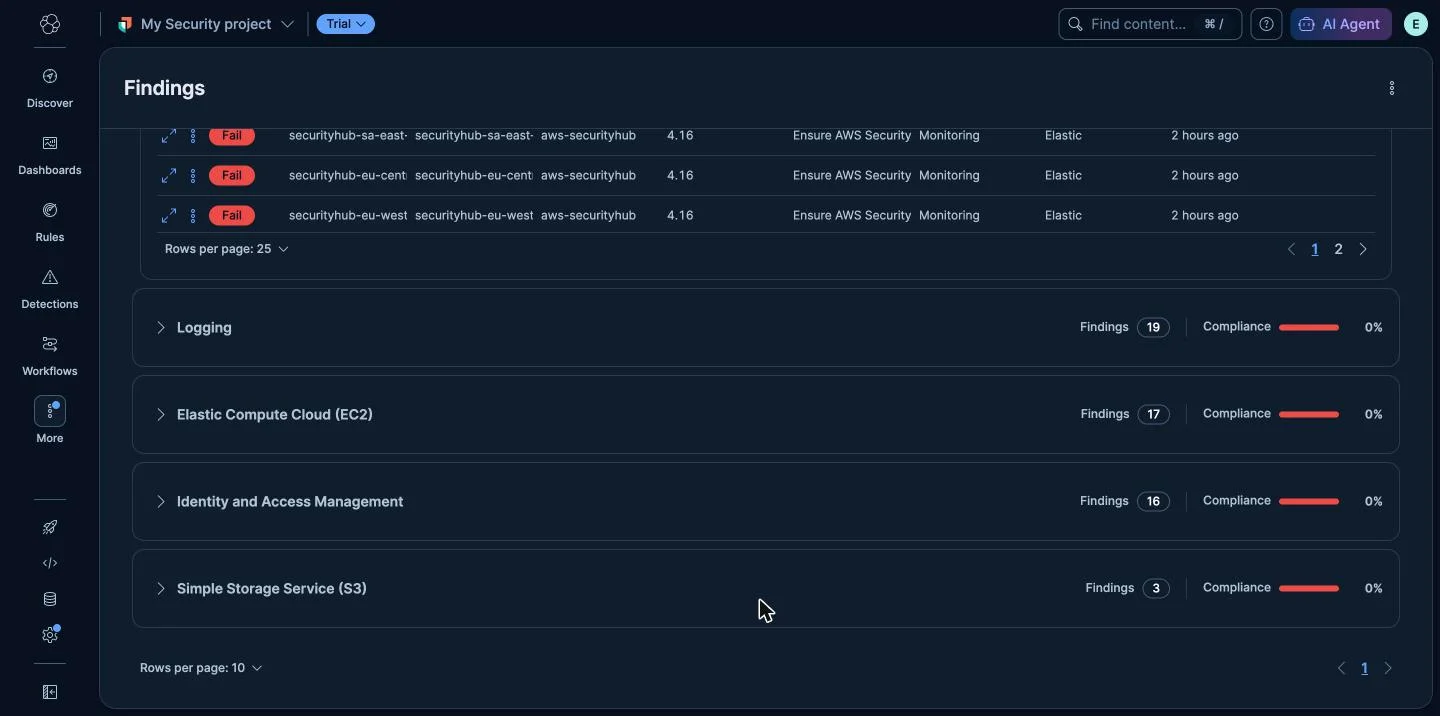
Then expand Monitoring, the second largest group at 32:
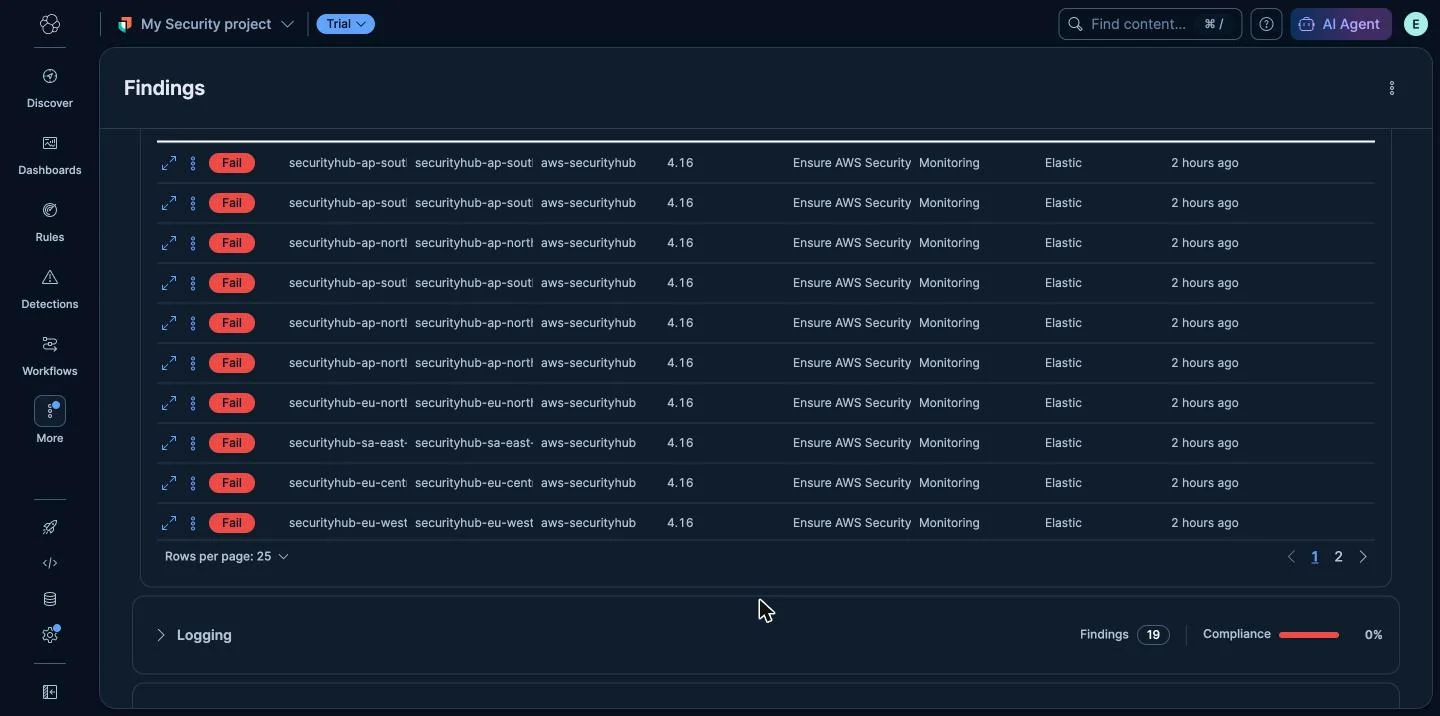
Every row I paged through is the same rule, CIS AWS 4.16, “Ensure AWS Security Hub is enabled,” failing once per region. One configuration decision (I have never turned on Security Hub in this account) produces 32 findings and drags an entire section to 0%. This is Reality Check 2 in a single screenshot: the finding count is not a count of problems, it is a count of rule-times-resource pairs, and the dashboard’s percentages weight them all equally. The Logging section’s 19 looks like the same shape, though I didn’t expand it to confirm. The IAM section’s 16, by contrast, are individually real: rules 1.12 (credentials unused for 45 days not disabled), 1.13 (more than one active access key on a user), and 1.14 (access keys older than 90 days), attached to leftover IAM users from old CI experiments. Those are the ones worth fixing first.
The practical reading: group before you count. rule.section and rule.id are the fields that turn 121 failures into “decide about Security Hub, turn on logging, clean up a handful of leftover IAM users,” which is a to-do list, not a crisis.
5. Which benchmark? Reading the score with its edition attached
Back to the version strings from the policy audit. Both dashboards print them, in small type on the benchmark card: CIS AWS v1.5.0 on the Cloud tab, CIS Kubernetes v1.0.1 on the Kubernetes tab. They match the spreadsheet filenames in the repo exactly, which is reassuring about the tool’s honesty and less reassuring about the editions.
CIS revises these benchmarks continuously. At the time of writing, CIS’s own November 2026 update lists the current editions as CIS AWS Foundations Benchmark v7.1.0 and CIS Kubernetes Benchmark v2.1.0. The AWS edition cloudbeat ships, v1.5.0, was published in August 2022 and is six major versions behind the current one; the Kubernetes one is the benchmark CIS wrote for Kubernetes 1.23 in 2022, and my cluster runs 1.34.
I want to be careful about what that does and doesn’t mean. It does not mean the checks are wrong; “don’t run the kubelet with anonymous auth” has not become bad advice. It means the rule set is a snapshot: newer editions add controls for services and failure modes that did not exist or weren’t covered in 2022, retire some, and renumber others. A 79% against v1.0.1 is not comparable to a 79% against v2.1.0, and a team reporting “we are 79% CIS compliant” to an auditor had better know which one they mean. It also means the per-section numbers inherit the old edition’s structure, and that RULES.md’s 74% implementation coverage is 74% of a 2022 checklist.
So how do you read a posture score honestly? The field is right there: rule.benchmark.version is on every finding document, and the dashboard card shows it. Make it part of how the number is reported, “79% against CIS Kubernetes v1.0.1,” every time. For AWS, cross-check against AWS’s own Security Hub, whose CIS standard supports several newer editions, so the same account graded two ways will show you exactly which findings are edition artifacts. For Kubernetes, kube-bench tracks CIS releases closely and runs in a few seconds as a Job; a second opinion from a tool on a different edition is cheap. And if you run cloudbeat itself, the policy repo is public: the gap between the spreadsheet in dev/input/ and CIS’s current download is a number you can check in a minute, and a question worth asking the maintainers.
6. So is 79% good? The work behind the two numbers
Because both targets are mine, I can answer the question the dashboard never does: how much of this is actually work for me, and how much is noise or somebody else’s problem.
The cluster, honestly. 201 failures. The 21 in the Kubelet block are not mine to fix: DigitalOcean manages the nodes and sets those flags, so the right move is an accepted exception or a question to the provider, not a change on my side. If I excepted those 21, the score would move to about 81%, and everything between 81% and 100% is my own workloads. That is the 180 findings in Pod Security Standards (103) and RBAC and Service Accounts (77), and they are entirely mine: the pod specs and role bindings of the things I run on this cluster, the automation, the search engine, the backups, the tunnel. I have not triaged them yet (I didn’t expand those groups the way I did Kubelet), so I can’t quote the rules, but the shape is familiar: a long tail of “this container runs as root,” “this service account token is mounted automatically,” “this role is broader than it needs to be,” fixed one Terraform change at a time and redeployed through CI. That is not a weekend. That is a quarter of small pull requests. The first one I’ll check is whether the scanner’s own DaemonSet, which runs as root with host mounts by design, is in that list; I haven’t looked yet, but it should be. So the verdict on 79%: the platform is in decent shape, and my workloads are the backlog.
The AWS account, honestly. 34% looks terrible, and most of it is a nearly empty account with its logging and monitoring switched off. The 121 failures collapse to a short list of decisions:
- Monitoring, 32: one rule, Security Hub, once per region. Enabling Security Hub in 32 regions is not free, and for an account this small the honest answer is to turn it on in the one region I use and record the rest as a known exception. One decision, not 32 fixes.
- Logging, 19: looks like the same per-region shape (I didn’t expand it). If it is what it looks like, the first copy of CloudTrail management events is free and you pay only for the storage. One action.
- IAM, 16: the ones with teeth. Leftover users from old CI experiments with aged or duplicate access keys. Delete the users I don’t need, rotate the key I do. An afternoon, and the only part of this list I’d call a real risk.
- Networking 34, EC2 17, S3 3: untriaged. From the section names these are most likely per-region defaults (flow logs, default security groups, encryption settings) rather than 54 separate problems, but I don’t know that yet and I’m not going to pretend I do.
So the AWS “to-do” is roughly one afternoon of IAM cleanup that matters, two account-level switches, and a triage pass over the rest. That is the useful translation of 34%: not “two-thirds broken,” but “nobody ever turned the lights on in this account, and a few old keys need to go.” Neither percentage would have told you that; the grouped findings did.
Where this fits in a real environment
For a team already running Elastic Security, cloudbeat is a strong answer to “what does our cloud and cluster configuration actually look like, continuously, in the same place as our alerts.” Lab step 3 is the case for it: a real kubelet command line in the finding document, remediation text attached, a Terraform-able deployment, and an open policy repo you can diff. The keyless AWS connector in step 4 is the way I would want every vendor to connect to an account, and the fact that I could read the one-resource template and grep the policy before clicking is the kind of transparency the “black box” critique is asking for.
Where it stops being enough is the number on the dashboard. Treat the score as an inventory with a date on it: it is a sample taken every few hours against a specific benchmark edition (Reality Check 1 and lab step 5), its counts are inflated by per-region and per-node fan-out (Reality Check 2), and the edition is chosen for you and lags CIS by years (Reality Check 3). Report it with its version, translate it into actual work before anyone reads it as a grade (lab step 6), group findings before you count them, and keep a second opinion on a newer edition for anything that gates a decision. And budget for what the collector holds (Reality Check 6): a root DaemonSet on every node and an assumable read-everything role are exactly the assets you would protect hardest if you were thinking about it as an attacker, so protect the agent’s enrollment, the Elastic deployment’s access, and the External ID like the credentials they effectively are.
Actionable Takeaways
- Read the benchmark edition before the score.
rule.benchmark.versionis on every finding and on the dashboard card. “79% against CIS Kubernetes v1.0.1” is a fact; “79% compliant” is a feeling. - Group findings before you count them. One disabled service failing per region can zero out a whole section.
rule.sectionandrule.idturn a failure count into a to-do list. - Translate the score into work before you report it. Mine came out as 21 cluster findings that aren’t mine to fix, 180 that are, and an AWS list that is one afternoon of IAM cleanup plus a few account-level switches. That sentence is more useful than either percentage.
- Prefer role trust with an External ID over pasted keys. Read the template first; a one-resource,
SecurityAudit-only role you can verify in a minute is the shape to insist on from any vendor. - Keep the enrollment token out of the manifest. Vendor-generated YAML with a secret inline goes into a sensitive variable and a Kubernetes Secret before it goes anywhere near a repo.
- Treat the scanner as a crown jewel. It is read-only and it is a complete map; protect its enrollment and its trust as you would a privileged credential.
A posture score is a photograph of your configuration taken against a checklist with a date on it. The photograph was sharp; the checklist was from 2022, and nothing on the dashboard says so out loud.
