Most incident response tooling forces a bad choice on you early in a case. Either you’re in a spreadsheet or a plain notebook with no structure, or you’re setting up a cloud platform with procurement friction, a rigid schema, and a data residency conversation before you’ve even confirmed the phishing email is real. Neither one matches the actual shape of early-stage IR work: messy notes, indicators that need pulling out and tracking, and relationships between them that you don’t know yet.
This week’s Rabbit Hole Generator pick was ThreatCaddy, a local-first investigation workspace that tries to sit in the middle of that gap. Everything, notes, IOCs, timelines, entity graphs, lives in the browser’s IndexedDB. No account, no server, no data leaving your machine unless you turn on the optional team sync yourself.
I ran the 30-minute lab straight from the repo, hit a real bug in the current release along the way, and root-caused and fixed it. Here’s what I found, plus a clean run of the actual lab against a known-working build.
What is ThreatCaddy used for in incident response investigations?
ThreatCaddy is an open-source, local-first investigation workspace for security analysts. It’s a TypeScript/React/Vite progressive web app that stores notes, extracted IOCs, timelines, and entity relationships entirely in the browser via IndexedDB (through Dexie.js), with IOC auto-extraction and a Cytoscape.js-powered graph view built in. There’s an optional Hono/PostgreSQL team server for shared investigations, but by default the browser is the entire system of record.
The Architecture: the browser as the system of record
The bet ThreatCaddy makes is that most analyst workflows don’t need a backend to be useful. Notes, IOC extraction, timelines, graph relationships, even AI-assisted workflows (there’s a CaddyAI agent system built in now, more on that below) can all run client-side with persistence in IndexedDB. That’s a real architectural choice, not just “we didn’t build a server yet.” It means the tool can start as a single-analyst forensic notebook and only grow into something shared when you actually decide it should.
The interesting part isn’t “browser storage” by itself, it’s the combination: local persistence, offline PWA support, optional encryption at rest, markdown notes with wiki-links, automatic IOC extraction, and a graph view that ties notes to the entities pulled out of them. That last piece solves a real gap. Analysts need to move between unstructured notes and structured indicators without doing a full data-modeling exercise first, and ThreatCaddy’s IOC engine does that extraction for you the moment you ask it to.
Since I first read the Notion writeup on this tool back in April, the project has grown considerably: an encryption-at-rest passphrase gate, a CaddyAI autonomous agent system, server sync, and an executive-mode dashboard have all landed. That’s worth noting on its own. In my book, The Centaur’s Edge, I write about pairing human judgment with machine-speed tooling rather than replacing one with the other. A local-first tool that extracts IOCs instantly but still puts the analyst in charge of the graph, the timeline, and the write-up is a decent small-scale example of that balance in practice.
The Reality Check: where local-first breaks down
Before you hand this to a team, know where it hits the wall.
1. Multi-analyst concurrency
Browser-local state with optional per-investigation sync creates real conflict-resolution problems the moment more than one analyst edits the same notes, tasks, or graph relationships in parallel. This is a single-analyst tool by default, and it shows.
2. Large investigation cardinality
Force-directed graph rendering, client-side IOC indexing, and browser storage access all degrade once an investigation has thousands of entities and relationships. Fine for a case file. Not built for a sprawling campaign tracker.
3. Enterprise retention and eDiscovery
IndexedDB-backed evidence and notes are hard to centrally archive, supervise, legal-hold, or audit across managed endpoints. If your org needs a defensible retention story, this tool doesn’t give you one out of the box.
4. Introduced vulnerability
Encryption keys, decrypted investigation content, and optional LLM or API credentials all live in the browser’s execution context. A malicious extension, an XSS bug, or a compromised endpoint can reach them. Local-first reduces some risk (nothing leaves your machine by default) but it doesn’t eliminate risk, it just relocates it to the browser sandbox.
5. A live example: the app didn’t render at all
This is the part I didn’t expect to find. When I cloned the current main branch (commit e91d417, well ahead of the version referenced in the original writeup) and ran pnpm dev, the app loaded a blank dark screen and stayed there. No console errors, every network request came back 200, and the React root mounted a single empty placeholder <div> and never went further.

I confirmed it wasn’t my environment: fresh browser tab, fresh IndexedDB, freshly fetched origin/main, same result every time. I root-caused it to src/hooks/useNotes.ts:
const mountedRef = useRef(true);
useEffect(() => { return () => { mountedRef.current = false; }; }, []);
This is a “don’t call setState after unmount” guard, a common pattern. It breaks under React 18/19 StrictMode, which deliberately mounts every component twice in development to catch exactly this class of bug: mount, run the effect, immediately unmount and run cleanup, then remount. The cleanup sets mountedRef.current = false. Nothing in the effect body ever sets it back to true on the real remount, since useRef(true) only runs its initializer once. The ref persists across StrictMode’s simulated cycle, so it’s permanently false from then on, even though the component is genuinely alive.
The consequence: loadNotes() reads from IndexedDB, then checks if (!mountedRef.current) return before calling setLoading(false). That check now always fails, so setLoading(false) never runs, the app’s dataReady gate in App.tsx never flips true, and the UI sits on an empty placeholder forever. It only bites when the Dexie query resolves fast enough to land after StrictMode’s synthetic unmount, which is reliably the case on a fresh, empty database, exactly the state anyone following this lab starts from.
The fix is one line, and it’s the standard, StrictMode-safe version of this exact pattern:
  const mountedRef = useRef(true);
- useEffect(() => { return () => { mountedRef.current = false; }; }, []);
+ useEffect(() => {
+   mountedRef.current = true;
+   return () => { mountedRef.current = false; };
+ }, []);
With that patch applied locally, the app rendered clean and stayed stable across repeated reloads.
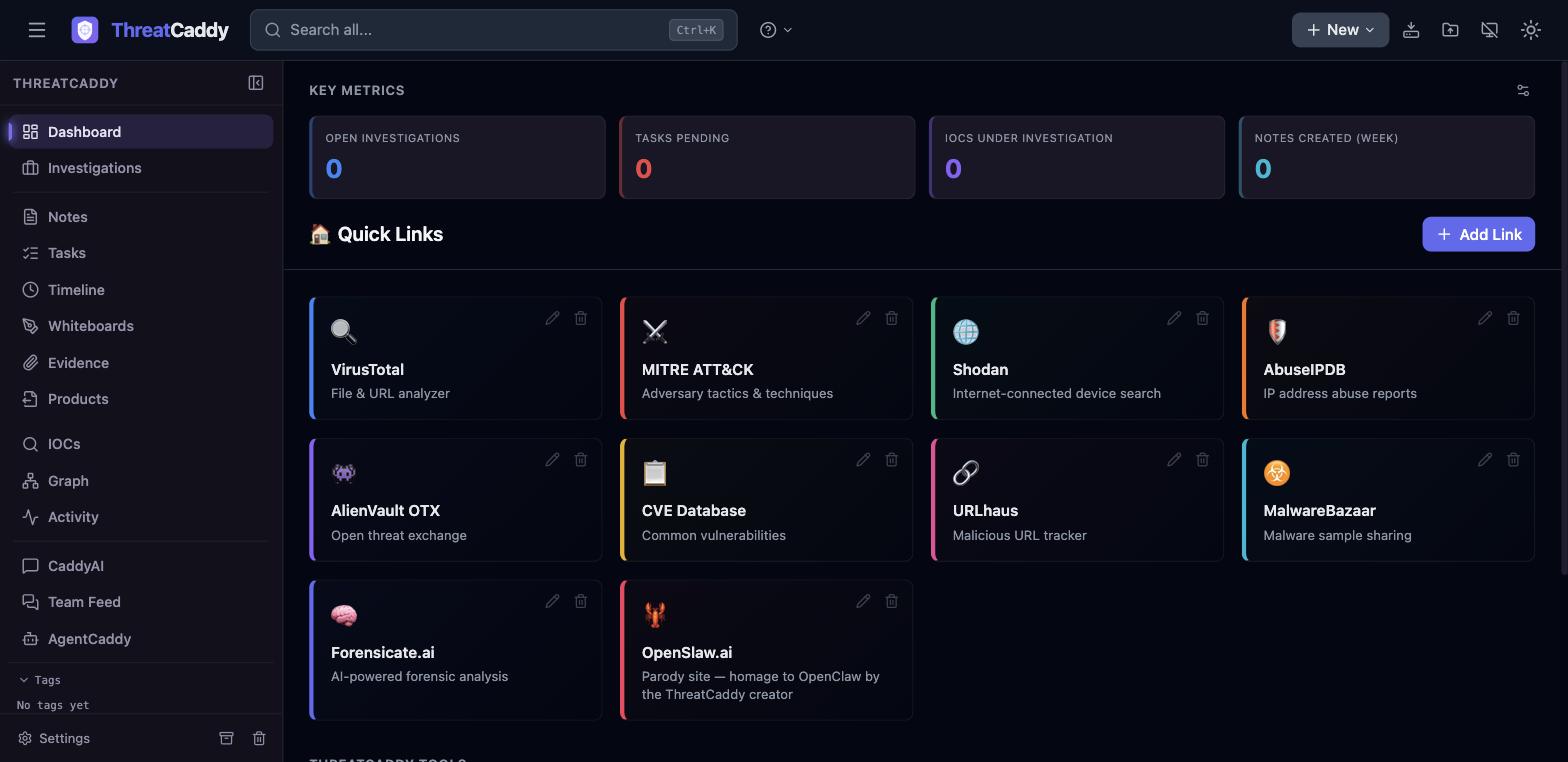
I’m disclosing this to the maintainer with the fix attached rather than just filing a bug report and moving on. It’s a small, single-maintainer project, and a real fix costs me nothing extra at this point.
The 30-Minute Lab: proving local-first IOC extraction
The goal: spin up ThreatCaddy locally, feed it a note full of realistic indicators, and prove it extracts and visualizes them without any data leaving the browser.
One disclosure before the walkthrough: I ran this specific lab against the last commit I’d confirmed working before I went down the render-bug rabbit hole above, not the freshly patched build shown in that last screenshot. Same IOC extraction engine, same Dexie schema, same result either way, but the screenshots below predate the sidebar features (CaddyAI, Evidence, Products, Team Feed) that show up in the “after fix” shot earlier in this post.
1. Installation
git clone https://github.com/peterhanily/threatcaddy.git
cd threatcaddy
pnpm install
pnpm dev
Expect some npm registry flakiness on pnpm install, ETIMEDOUT and ECONNRESET retries are normal and not a sign anything’s wrong; pnpm retries automatically. Install time varies a lot run to run depending on cache state, anywhere from ten seconds to over a minute for the same lockfile.
2. The test note
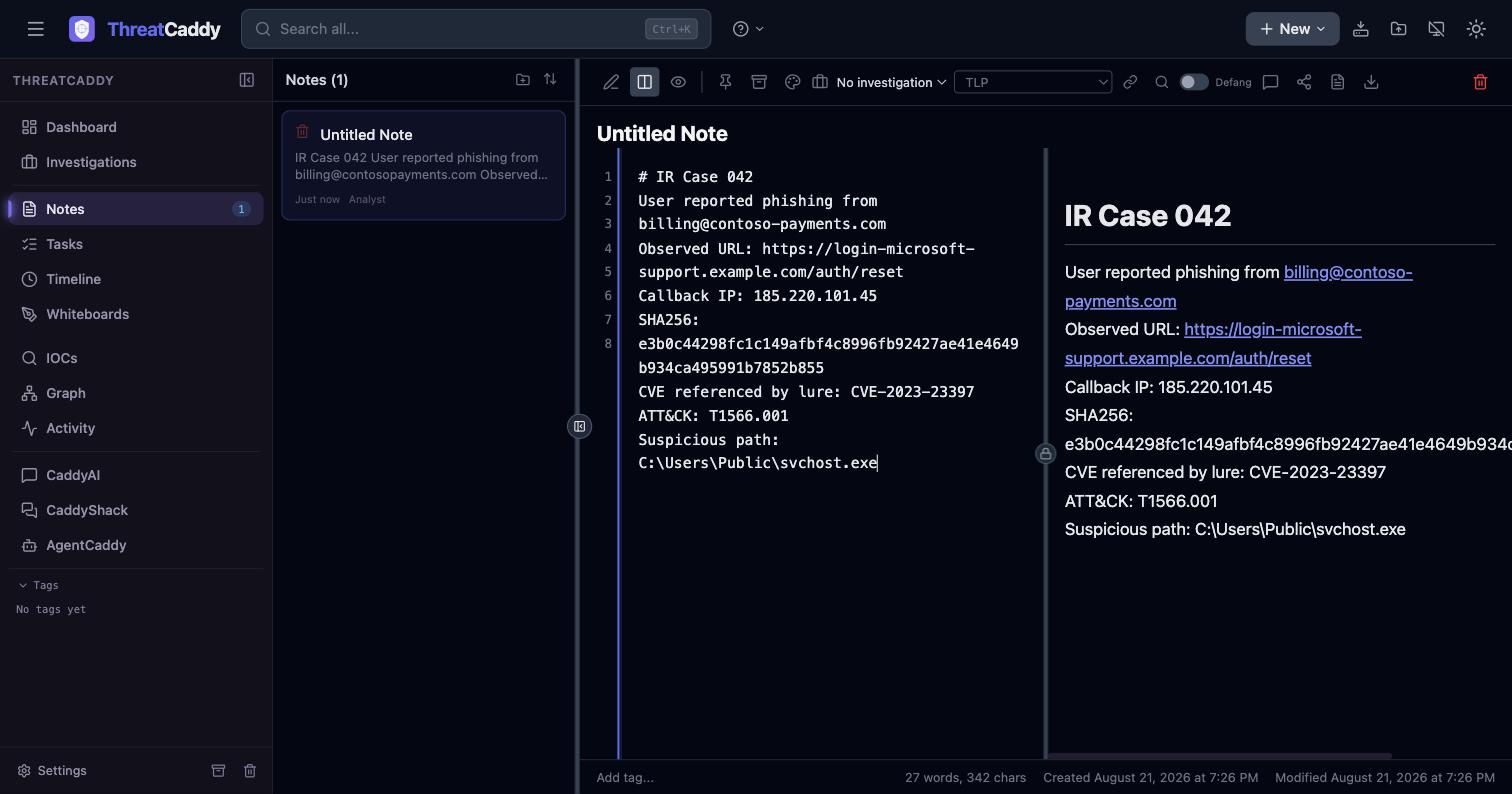
I used the exact IOC-laden note from the lab instructions:
# IR Case 042
User reported phishing from [email protected]
Observed URL: https://login-microsoft-support.example.com/auth/reset
Callback IP: 185.220.101.45
SHA256: e3b0c44298fc1c149afbf4c8996fb92427ae41e4649b934ca495991b7852b855
CVE referenced by lure: CVE-2023-23397
ATT&CK: T1566.001
Suspicious path: C:\Users\Public\svchost.exe
One gotcha worth flagging: the lab instructions describe opening this as a file via a “New > Open File” menu action. That menu item now only accepts .json backup files, and a separate “Import Data” option only takes CSV/TSV/JSON/NDJSON. The actual path that works today is simpler: create a new note (New > Quick Note), paste the content directly into the markdown editor, and let the live preview render it. UI details like this drift over time; if a step in a lab like this doesn’t match what you see, look for the nearest equivalent action rather than assuming the tool is broken.
3. Running the analysis
IOC extraction isn’t automatic on typing, it runs when you click the magnifying-glass “Analyze” icon in the note’s toolbar. One click, and the IOC Analysis panel populated with all seven indicator types in the test note:
- Email:
[email protected] - URL:
https://login-microsoft-support.example.com/auth/reset - IPv4:
185.220.101.45 - SHA-256:
e3b0c44298fc1c149afbf4c8996fb92427ae41e4649b934ca495991b7852b855 - CVE:
CVE-2023-23397 - MITRE ATT&CK:
T1566.001 - File Path:
C:\Users\Public\svchost.exe
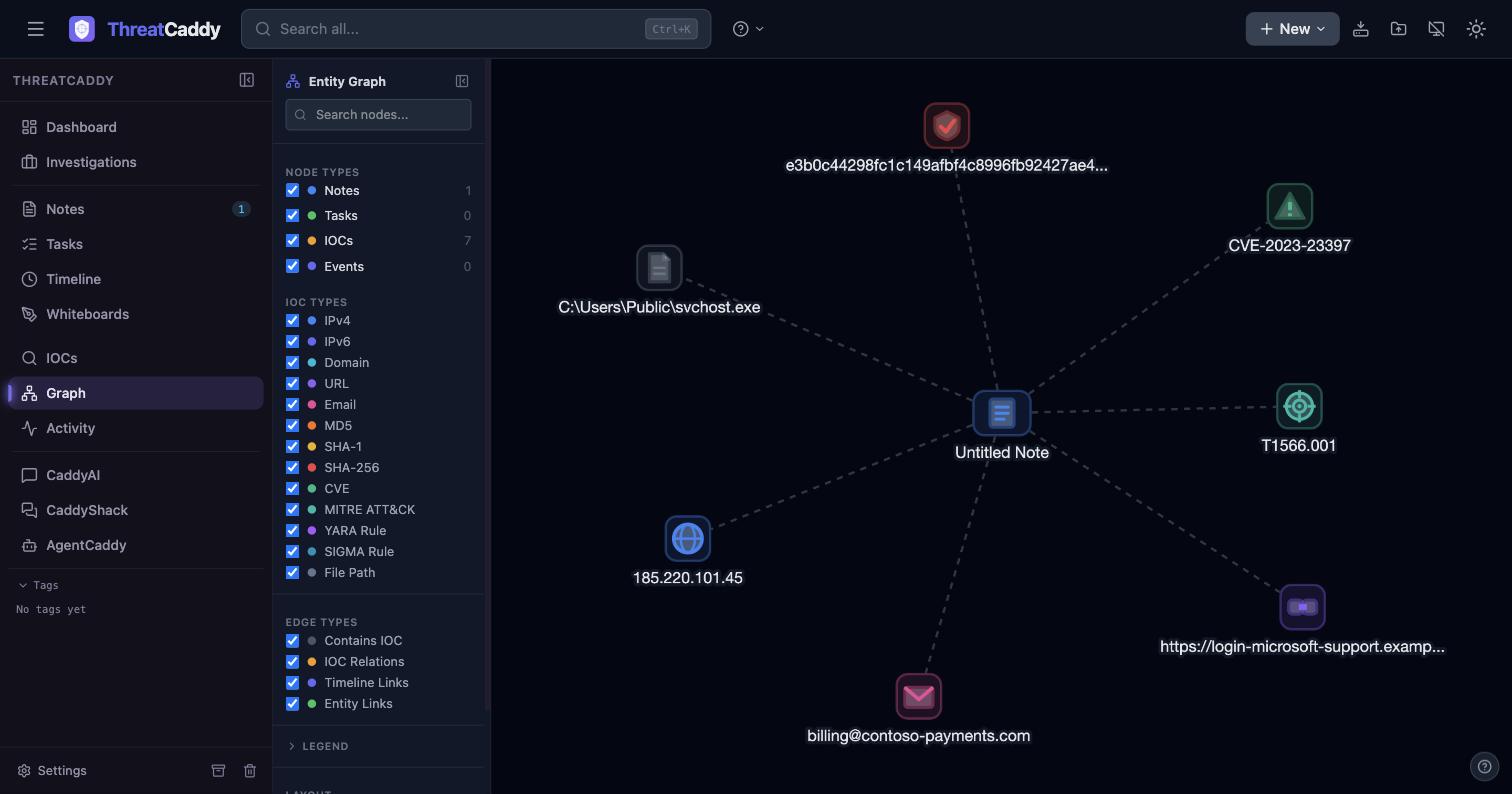
Switching to the Graph view showed the note as a center node with dashed edges to all seven extracted entities, exactly what the tool promises: unstructured text in, a structured relationship graph out.
Last check, proving the data never left the browser:
> indexedDB.databases().then(dbs => console.table(dbs))
[{ name: "ThreatCaddyDB", version: 320 }]
I reloaded the page and confirmed the note, all 7 IOCs, and their graph relationships persisted, with no network calls involved beyond the initial dev server assets. Full dashboard for reference:
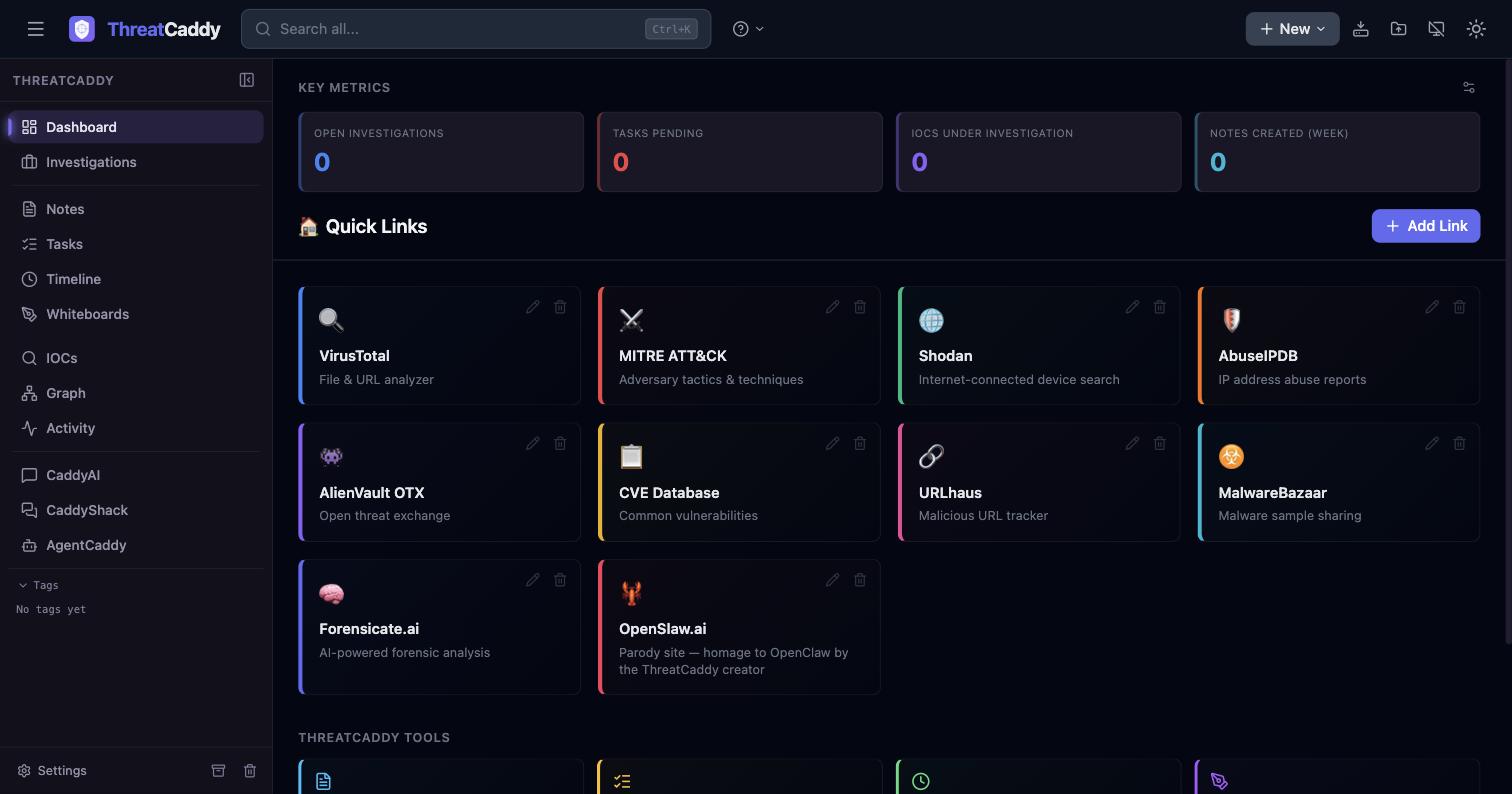
That’s every success criterion from the original lab: a visible note, visible extracted IOCs, a visible graph relationship, and a visible console.table output listing the local database.
Actionable Takeaways
- Local-first is a real option for early-stage IR, not just a privacy gimmick. If your team is reluctant to paste case material into a SaaS tool, or you need something running before procurement finishes, a browser-based workspace with structured IOC extraction is a legitimate stopgap.
- Don’t transcribe a lab blindly, run it. The exact click-path in the original instructions had already gone stale by the time I ran it, and the current release didn’t even render until I found and fixed a real bug. Verifying beats copying every time.
- StrictMode double-invoke is still catching real bugs in 2026. If you maintain a React app with a “mounted” ref pattern, check that it resets to
trueon mount, not justfalseon cleanup. It’s a one-line fix and a completely silent failure mode without it.
A tool that gives an analyst a structured notebook in thirty seconds, with the indicators already pulled out and graphed, is worth having in your kit even knowing exactly where it stops being enough.
